Nuevo
Timetec Pinnacle 1TB PCIe 3.0 x4 NVMe M.2 2280
Capacity 1TB
Form Factor M.2 2280
Interface PCIe 3.0 x4
Read Speed 2,000 MB/s
NAND QLC
Endurance 1000 TBW

47 Puntuación global
Sin precio actual de tiendas


Resumen
Ventajas y desventajas
Ventajas
- Strong endurance (94th percentile) 94th
Desventajas
- Below average feature (14th percentile)
Opinión de los propietarios
Cómo cambió la opinión de los propietarios con el tiempo
ExclusivaSegún cuándo escribieron realmente sus opiniones los clientes, para ver si los elogios iniciales se mantuvieron.
9 opiniones escritas, mar 2024 – dic 2025: 7 satisfechos, 2 insatisfechos
En las 54 valoraciones de tiendas: 4,4★. La mayoría de los propietarios valora sin escribir una opinión. El gráfico cuenta las 9 opiniones escritas.
Cada punto es una opinión escrita, en el mes en que se escribió. Satisfechos = 4-5★, neutrales = 3★, insatisfechos = 1-2★.
Las pruebas
Rendimiento
Especificaciones
Especificaciones completas
Drive
| Capacity | 1000 |
| Form Factor | M.2 2280 |
| Interface | PCIe 3.0 x4 |
| Protocol | NVMe |
| PCIe Generation | 3 |
| External | No |
Performance
| Sequential Read (MB/s) | 2000 |
| Sequential Write (MB/s) | 1600 |
Hardware
| NAND | QLC |
| DRAM Cache | No |
Reliability
| Endurance (TBW) | 1000 |
| MTBF (hours) | 1500000 |
| Warranty (years) | 5 |
Features
| Heatsink | No |
| Hardware Encryption | No |
Frente a la competencia
| Spec | Timetec Pinnacle | Samsung 9100 PRO | Kingston KC3000 | Crucial T700 | Western Digital WD_BLACK SN8100 | Lexar Professional NM1090 PRO |
|---|---|---|---|---|---|---|
| Capacity | 1TB | 2TB | 2TB | 2TB | 1TB | 2TB |
| Form Factor | M.2 2280 | M.2 2280 | M.2 2280 | M.2 2280 | M.2 2280 | M.2 2280 |
| Interface | PCIe 3.0 x4 | PCIe 5.0 x4 | PCIe 4.0 x4 | PCIe 5.0 x4 | PCIe 5.0 x4 | PCIe 5.0 x4 |
| Seq Read | 2,000 MB/s | 14,700 MB/s | 7,000 MB/s | 12,400 MB/s | 14,900 MB/s | 14,000 MB/s |
| Nand Type | QLC | TLC | TLC | TLC | TLC | TLC |
| Dram Cache | false | true | true | true | true | true |
| Endurance | 1000 TBW | 1200 TBW | 1600 TBW | 1200 TBW | 600 TBW | 1400 TBW |
| Compare | Compare | Compare | Compare | Compare |
| Producto | Speed | Random | Feature | Capacity | Endurance | Valoración social | Affordability |
|---|---|---|---|---|---|---|---|
| Timetec Pinnacle | 47.8 | 61.7 | 14.4 | 55.5 | 93.8 | 41.2 | 63.3 |
| Samsung 9100 PRO Compare | 98.9 | 99.8 | 99.7 | 78.6 | 85.7 | 94.9 | 21.1 |
| Kingston KC3000 Compare | 88.5 | 94.4 | 93.9 | 78.6 | 92.9 | 85.8 | 26.4 |
| Crucial T700 Compare | 96.6 | 97.6 | 97.5 | 78.6 | 82.5 | 75.1 | 21.9 |
| Western Digital WD_BLACK SN8100 Compare | 97.8 | 98.6 | 99.7 | 55.5 | 80.4 | 94.9 | 38.9 |
| Lexar Professional NM1090 PRO Compare | 98.2 | 98.5 | 97.5 | 78.6 | 91.1 | 45.5 | 25.6 |
Precio
Relación calidad-precio
Historial de precios
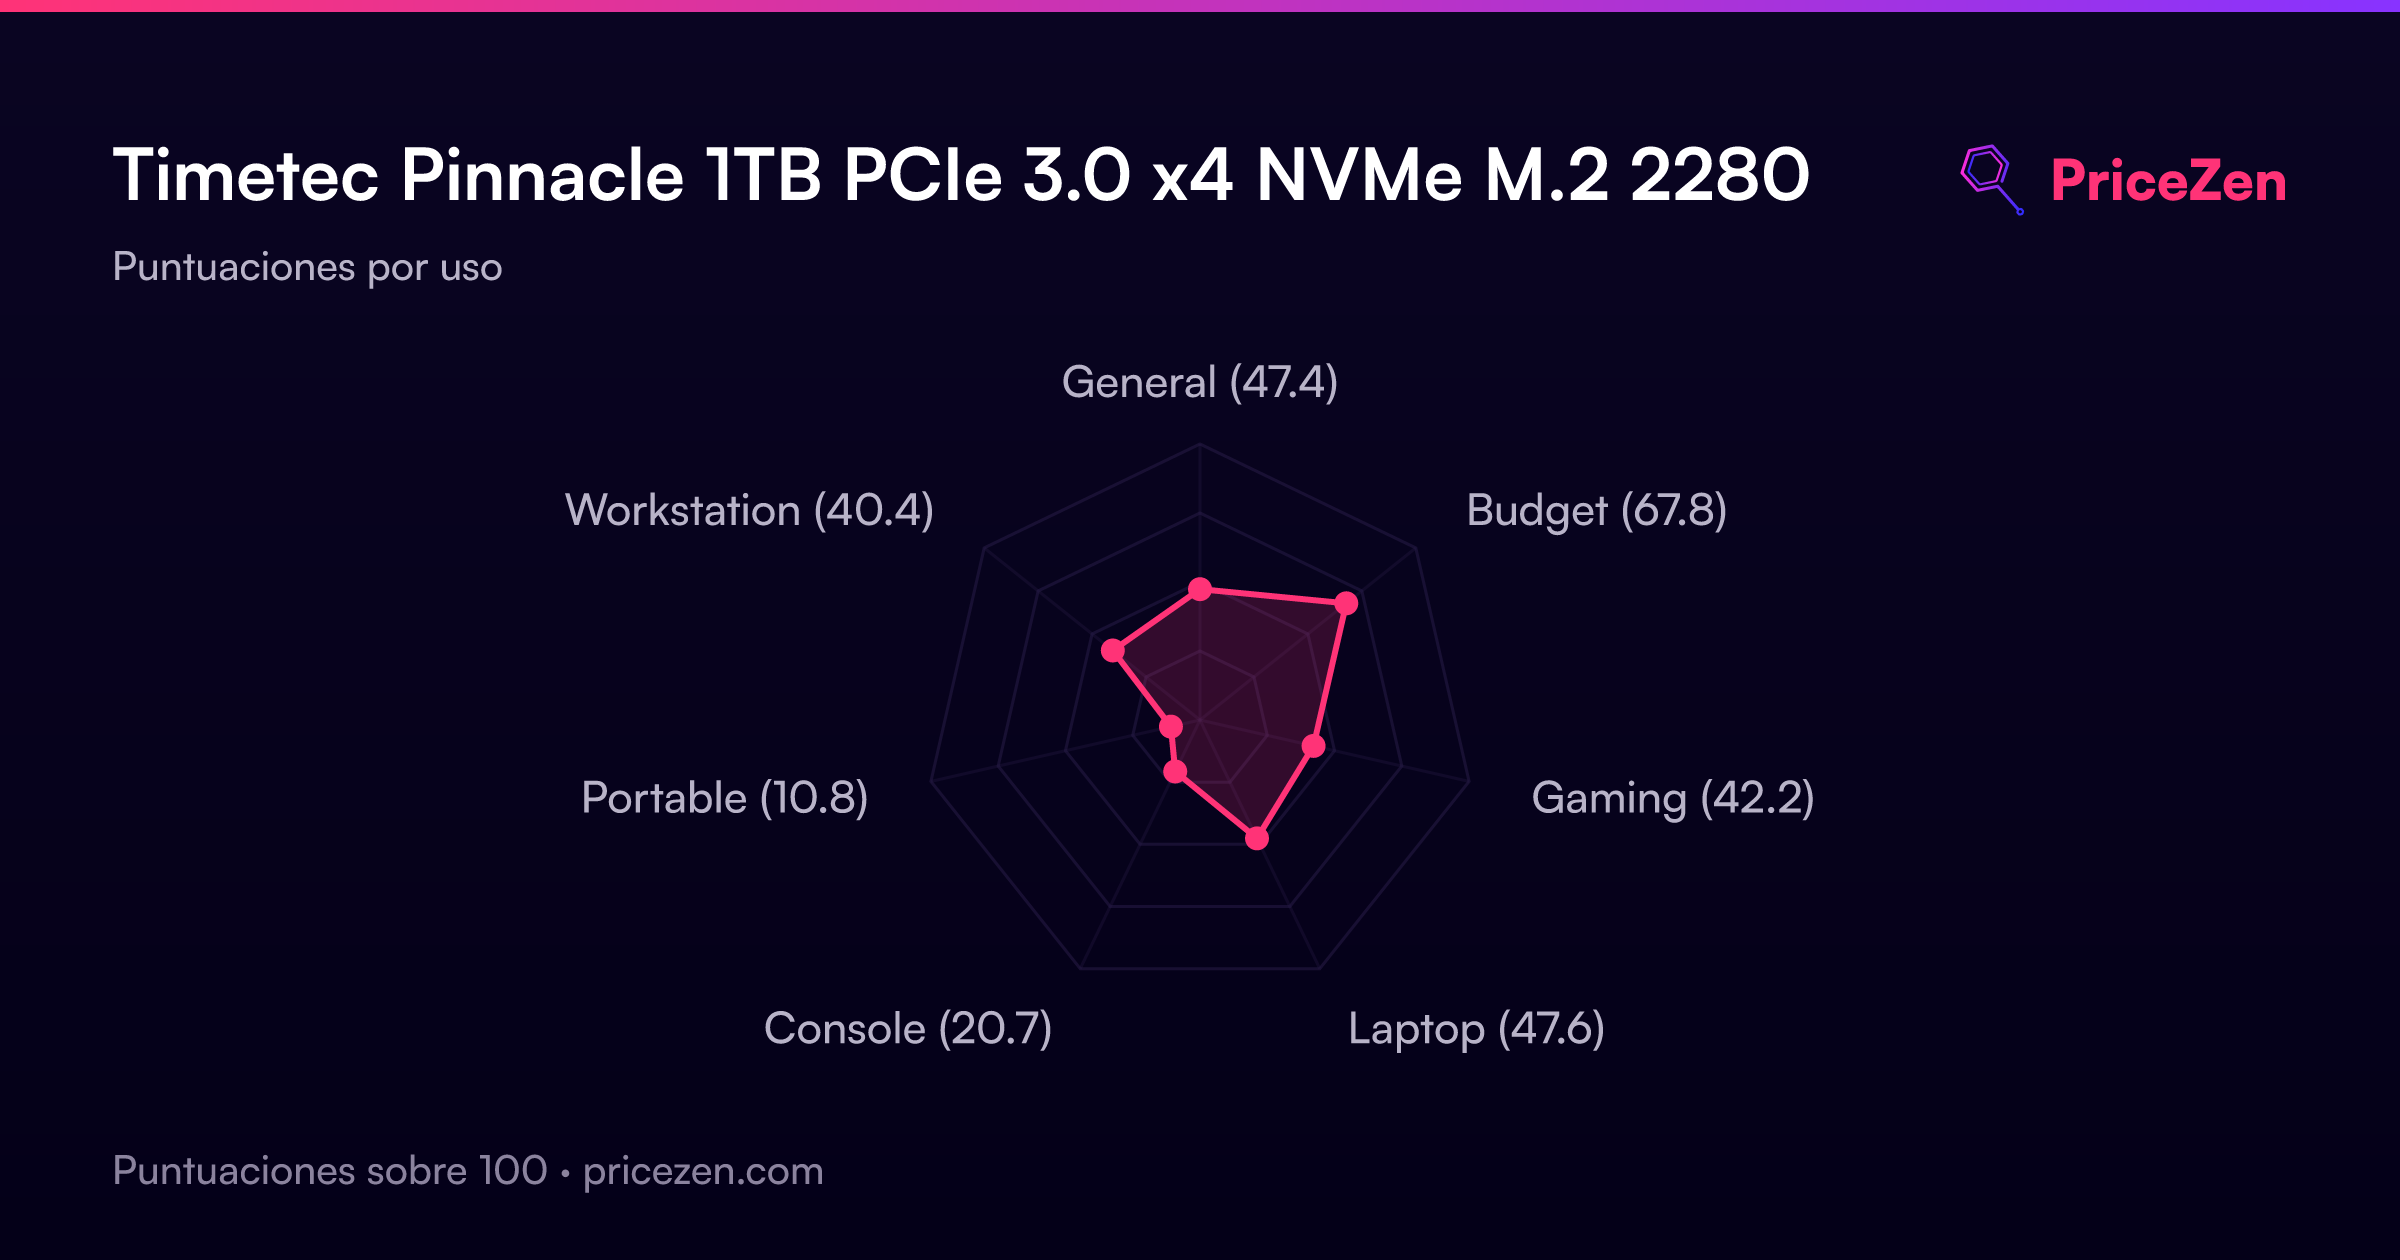
Puntuaciones por uso
- General47.4
- Budget67.8
- Gaming42.2
- Laptop47.6
- Console20.7
- Portable10.8
- Workstation40.4
Pronto habrá un análisis completo. Las especificaciones, puntuaciones, precios y gráficos de arriba siempre están actualizados.