New
Timetec Pinnacle 1TB PCIe 3.0 x4 NVMe M.2 2280
Capacity 1TB
Form Factor M.2 2280
Interface PCIe 3.0 x4
Read Speed 2,000 MB/s
NAND QLC
Endurance 1000 TBW

47 Overall Score
No current retailer price


Snapshot
Pros & Cons
Pros
- Strong endurance (94th percentile) 94th
Cons
- Below average feature (15th percentile)
What owners think
How owner sentiment changed over time
ExclusiveBased on when customers actually wrote their reviews - so you can see whether early praise held up.
9 written reviews, Mar 2024 – Dec 2025: 7 happy, 2 unhappy
Across all 54 store ratings: 4.4★. Most owners rate without writing a review. The chart counts the 9 written reviews.
Each dot is one written review, in the month it was written. Happy = 4-5★, mixed = 3★, unhappy = 1-2★.
The proof
Performance
Specifications
Full Specifications
Drive
| Capacity | 1000 |
| Form Factor | M.2 2280 |
| Interface | PCIe 3.0 x4 |
| Protocol | NVMe |
| PCIe Generation | 3 |
| External | No |
Performance
| Sequential Read (MB/s) | 2000 |
| Sequential Write (MB/s) | 1600 |
Hardware
| NAND | QLC |
| DRAM Cache | No |
Reliability
| Endurance (TBW) | 1000 |
| MTBF (hours) | 1500000 |
| Warranty (years) | 5 |
Features
| Heatsink | No |
| Hardware Encryption | No |
vs Competition
| Spec | Timetec Pinnacle | Samsung 9100 PRO | Kingston KC3000 | Crucial T700 | Western Digital WD_BLACK SN8100 | XPG GAMMIX S70 Blade |
|---|---|---|---|---|---|---|
| Capacity | 1TB | 2TB | 2TB | 2TB | 1TB | 2TB |
| Form Factor | M.2 2280 | M.2 2280 | M.2 2280 | M.2 2280 | M.2 2280 | M.2 2280 |
| Interface | PCIe 3.0 x4 | PCIe 5.0 x4 | PCIe 4.0 x4 | PCIe 5.0 x4 | PCIe 5.0 x4 | PCIe 4.0 x4 |
| Seq Read | 2,000 MB/s | 14,700 MB/s | 7,000 MB/s | 12,400 MB/s | 14,900 MB/s | 7,400 MB/s |
| Nand Type | QLC | TLC | TLC | TLC | TLC | TLC |
| Dram Cache | false | true | true | true | true | true |
| Endurance | 1000 TBW | 1200 TBW | 1600 TBW | 1200 TBW | 600 TBW | 1480 TBW |
| Compare | Compare | Compare | Compare | Compare |
| Product | Speed | Random | Feature | Capacity | Endurance | Social Proof | Affordability |
|---|---|---|---|---|---|---|---|
| Timetec Pinnacle | 47.8 | 61.7 | 14.5 | 55.5 | 93.8 | 41.2 | 63.4 |
| Samsung 9100 PRO Compare | 98.9 | 99.8 | 99.7 | 78.6 | 85.7 | 94.9 | 21.1 |
| Kingston KC3000 Compare | 88.5 | 94.4 | 93.9 | 78.6 | 92.9 | 85.8 | 26.4 |
| Crucial T700 Compare | 96.6 | 97.6 | 97.5 | 78.6 | 82.5 | 75.1 | 22 |
| Western Digital WD_BLACK SN8100 Compare | 97.8 | 98.6 | 99.7 | 55.5 | 80.4 | 94.9 | 39 |
| XPG GAMMIX S70 Blade Compare | 93 | 90.5 | 93.9 | 78.6 | 77.2 | 75.1 | 30.8 |
Price
Value & Pricing
Price history
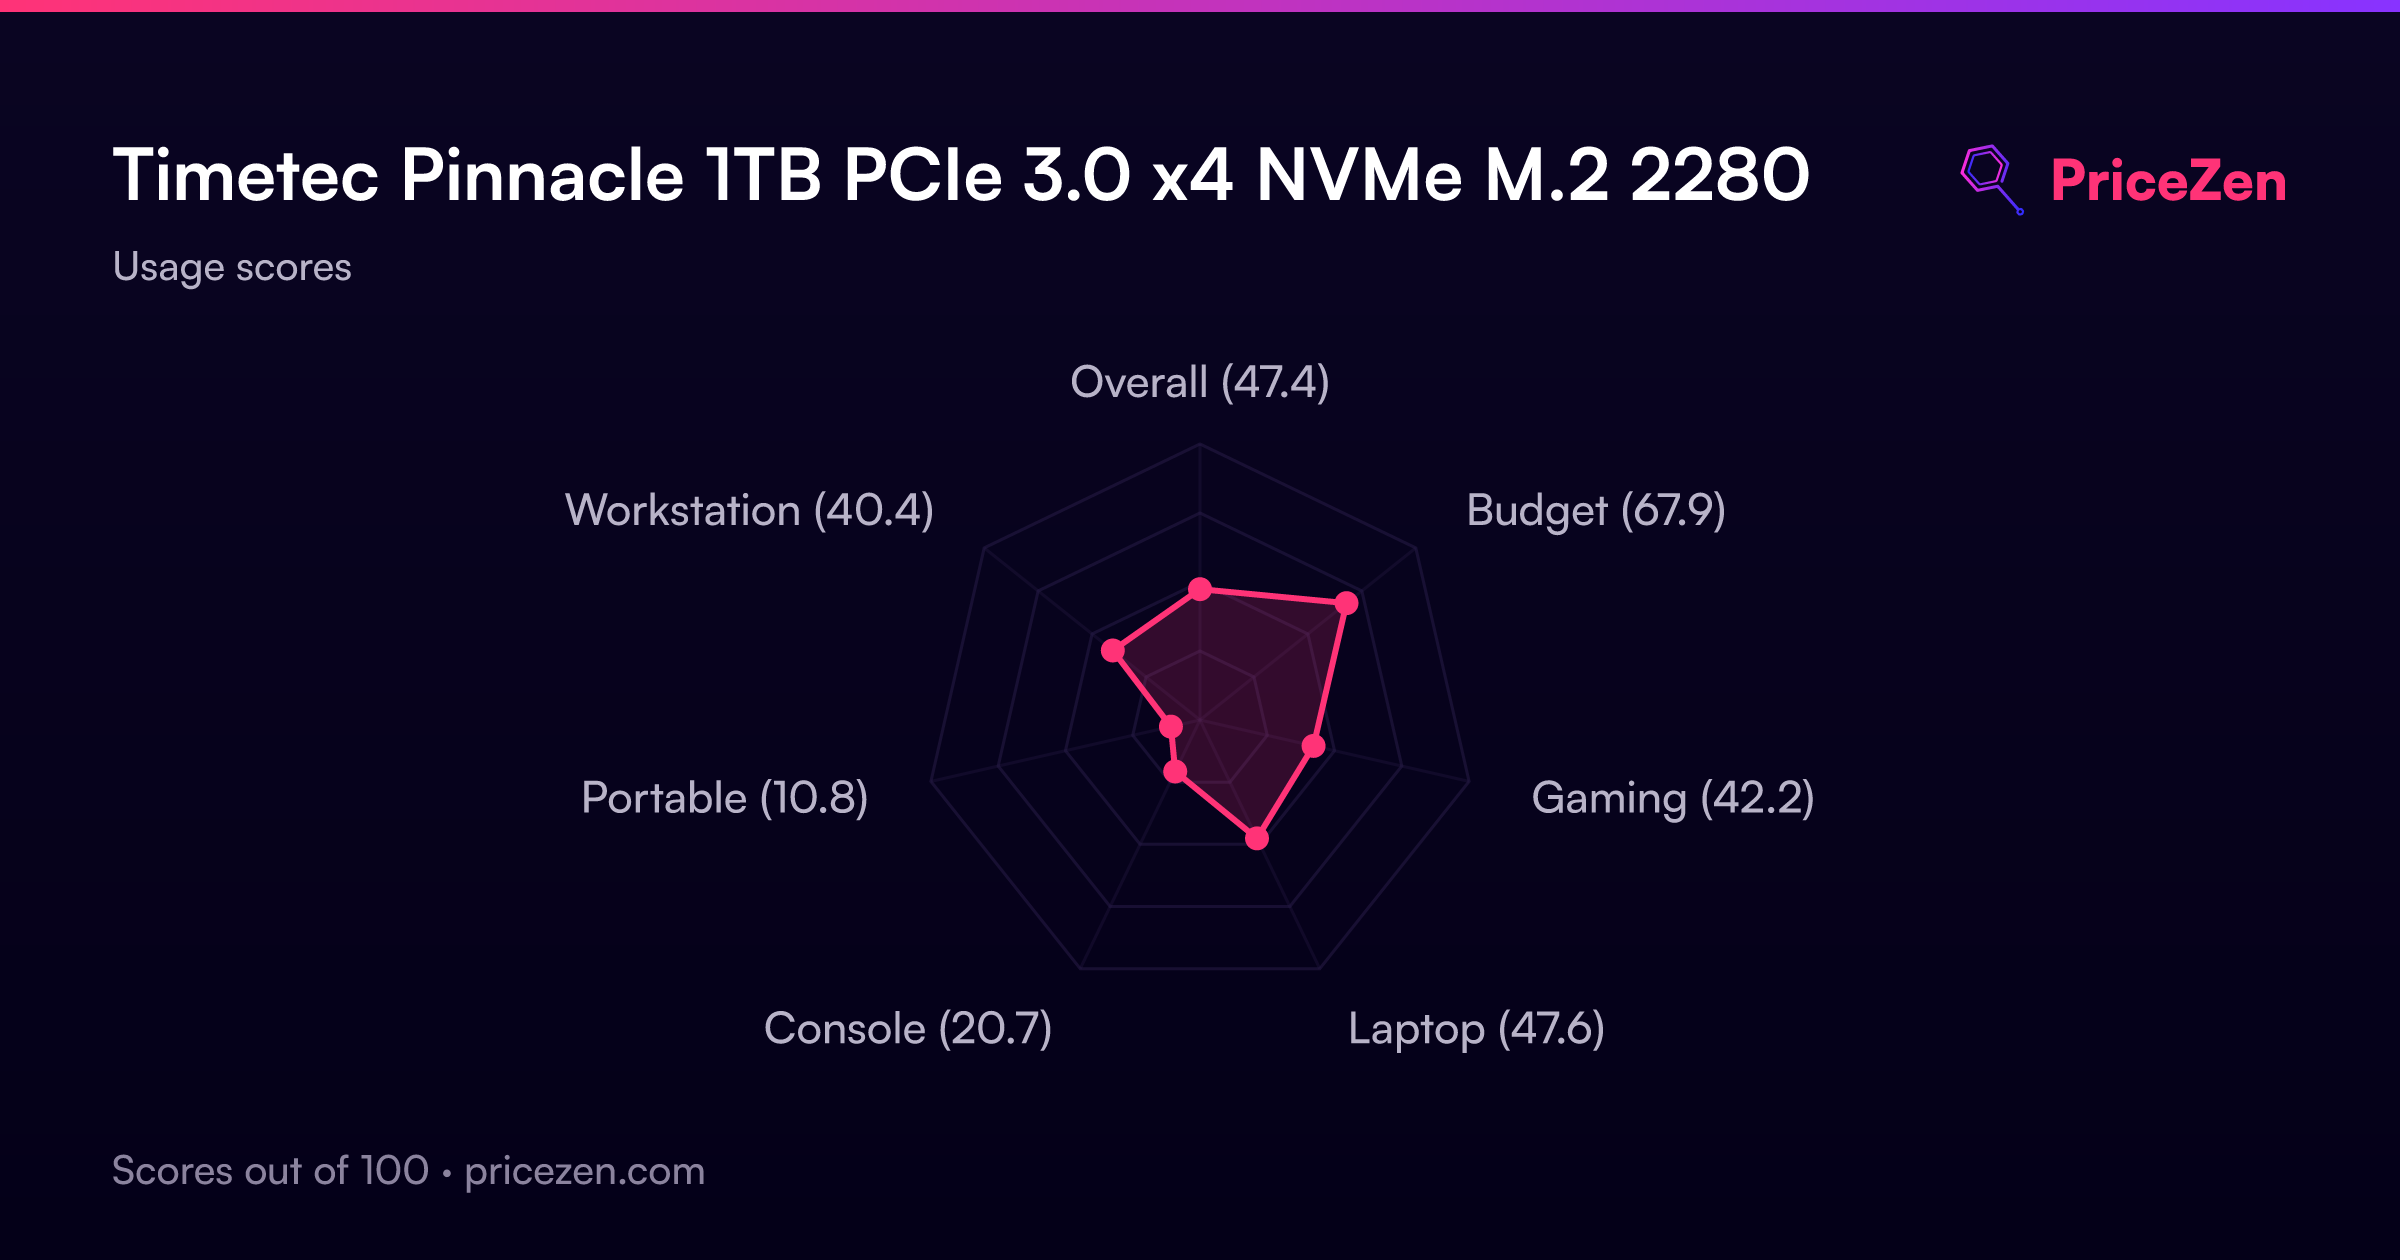
Usage Scores
- Overall47.4
- Budget67.9
- Gaming42.2
- Laptop47.6
- Console20.7
- Portable10.8
- Workstation40.4
A full written review is coming soon. The specs, scores, prices and charts above are always up to date.