Thunderobot Radiant 16 2025, Core i9-14900HX, 16GB, 512GB SSD, RTX 5070 Ti, Gray
The 24-core Intel Core i9-14900HX and GeForce RTX 5070 Ti drive a 300Hz QHD+ display, making this a strong performer for high-refresh-rate gaming. Its 16-inch 2560x1600 panel offers pro-grade color accuracy, suiting both competitive play and content creation in a 2.1kg chassis. This laptop is best for esports gamers and streamers who need high frame rates and color precision without prioritizing portability.
CPU Intel Core i9 14900HX
RAM 16 GB
Storage 512 GB
Screen 16" 2560x1600
GPU NVIDIA GeForce RTX 5070 Ti
OS Windows 11 Home
Weight 2.1 kg

51 Puntuación global
Sin precio actual de tiendas
Resumen
Ventajas y desventajas
Ventajas
- Strong gpu (97th percentile) 97th
- Strong cpu (93rd percentile) 93rd
- Strong screen (87th percentile) 87th
Desventajas
- Below average reliability (4th percentile)
- Below average portability (18th percentile)
- Below average affordability (23rd percentile)
Las pruebas
Rendimiento
Especificaciones
Especificaciones completas
Processor
| CPU | Intel Core i9 14900HX |
| Cores | 24 |
| Frequency | 1.6 GHz |
| L3 Cache | 36 MB |
Graphics
| GPU | NVIDIA GeForce RTX 5070 Ti |
| Type | Discrete |
| VRAM | 12 GB |
| VRAM Type | GDDR7 |
Memory & Storage
| RAM | 16 GB |
| RAM Generation | DDR5 |
| Storage | 512 GB |
| Storage Type | SSD |
Display
| Size | 16" |
| Resolution | 2560x1600 (QHD) |
| Refresh Rate | 300 Hz |
Connectivity
| USB-C Ports | 1 |
| USB Ports | 3 |
| HDMI | 1 x HDMI |
| Wi-Fi | Wi-Fi 6 |
| Bluetooth | Yes |
| Ethernet | 1x Ethernet (RJ-45) |
Physical
| Weight | 2.1 kg / 4.6 lbs |
| OS | Windows 11 Home |
Frente a la competencia
| Spec | Thunderobot Radiant 16 | Apple MacBook Pro 14.2" M4 Max | ASUS ROG Zephyrus 14" GA403WW-G14.R95080 | Lenovo Legion Pro 7i Gen 10 16" | HP OMEN Transcend | Samsung Galaxy Book5 Pro 14" NP944XHA-KG3US |
|---|---|---|---|---|---|---|
| CPU | Intel Core i9 14900HX | Apple M4 Max | AMD Ryzen AI 9 HX 370 | Intel Core Ultra 9 275HX | Intel Core Ultra 9 285H | Intel Core Ultra 7 258V |
| RAM (GB) | 16 | 64 | 32 | 32 | 32 | 32 |
| Storage (GB) | 512 | 4096 | 2048 | 1024 | 1024 | 1024 |
| Screen | 16" 2560x1600 | 14.2" 3024x1964 | 14" 2880x1800 | 16" 2560x1600 | 14" 2880x1800 | 14" 2880x1800 |
| GPU | NVIDIA GeForce RTX 5070 Ti | Apple (40-Core) | NVIDIA GeForce RTX 5080 | NVIDIA GeForce RTX 5070 Ti | NVIDIA GeForce RTX 5070 | Intel Arc Graphics 140V |
| OS | Windows 11 Home | macOS | Windows 11 Home | Windows 11 Home | Windows 11 Home | Windows 11 Pro |
| Weight (kg) | 2.1 | 1.6 | 1.6 | 2.7 | 1.6 | 1.2 |
| Battery (Wh) | - | 72 | - | 99 | 71 | 63 |
| Compare | Compare | Compare | Compare | Compare |
| Producto | CPU | GPU | RAM | Puertos | Pantalla | Portabilidad | Almacenamiento | Fiabilidad | Affordability |
|---|---|---|---|---|---|---|---|---|---|
| Thunderobot Radiant 16 | 93.2 | 96.6 | 54.6 | 60.4 | 87.4 | 17.6 | 35.7 | 4 | 22.5 |
| Apple MacBook Pro 14.2" M4 Max Compare | 93.7 | 91.6 | 95.7 | 73.2 | 99.3 | 68.9 | 98.5 | 98.3 | 1.7 |
| ASUS ROG Zephyrus 14" GA403WW-G14.R95080 Compare | 91.2 | 98.3 | 90.9 | 89.2 | 96.5 | 73.6 | 89.7 | 60.6 | 5.7 |
| Lenovo Legion Pro 7i Gen 10 16" Compare | 97.2 | 96.6 | 89 | 97.2 | 95.6 | 9.5 | 79.2 | 82.1 | 5.5 |
| HP OMEN Transcend Compare | 90.1 | 93.6 | 89.7 | 89.2 | 96.5 | 72.3 | 65.1 | 33.6 | 8.3 |
| Samsung Galaxy Book5 Pro 14" NP944XHA-KG3US Compare | 65.7 | 69.6 | 79.4 | 83.1 | 91.5 | 89.5 | 79.2 | 82.1 | 20.1 |
Precio
Relación calidad-precio
Historial de precios
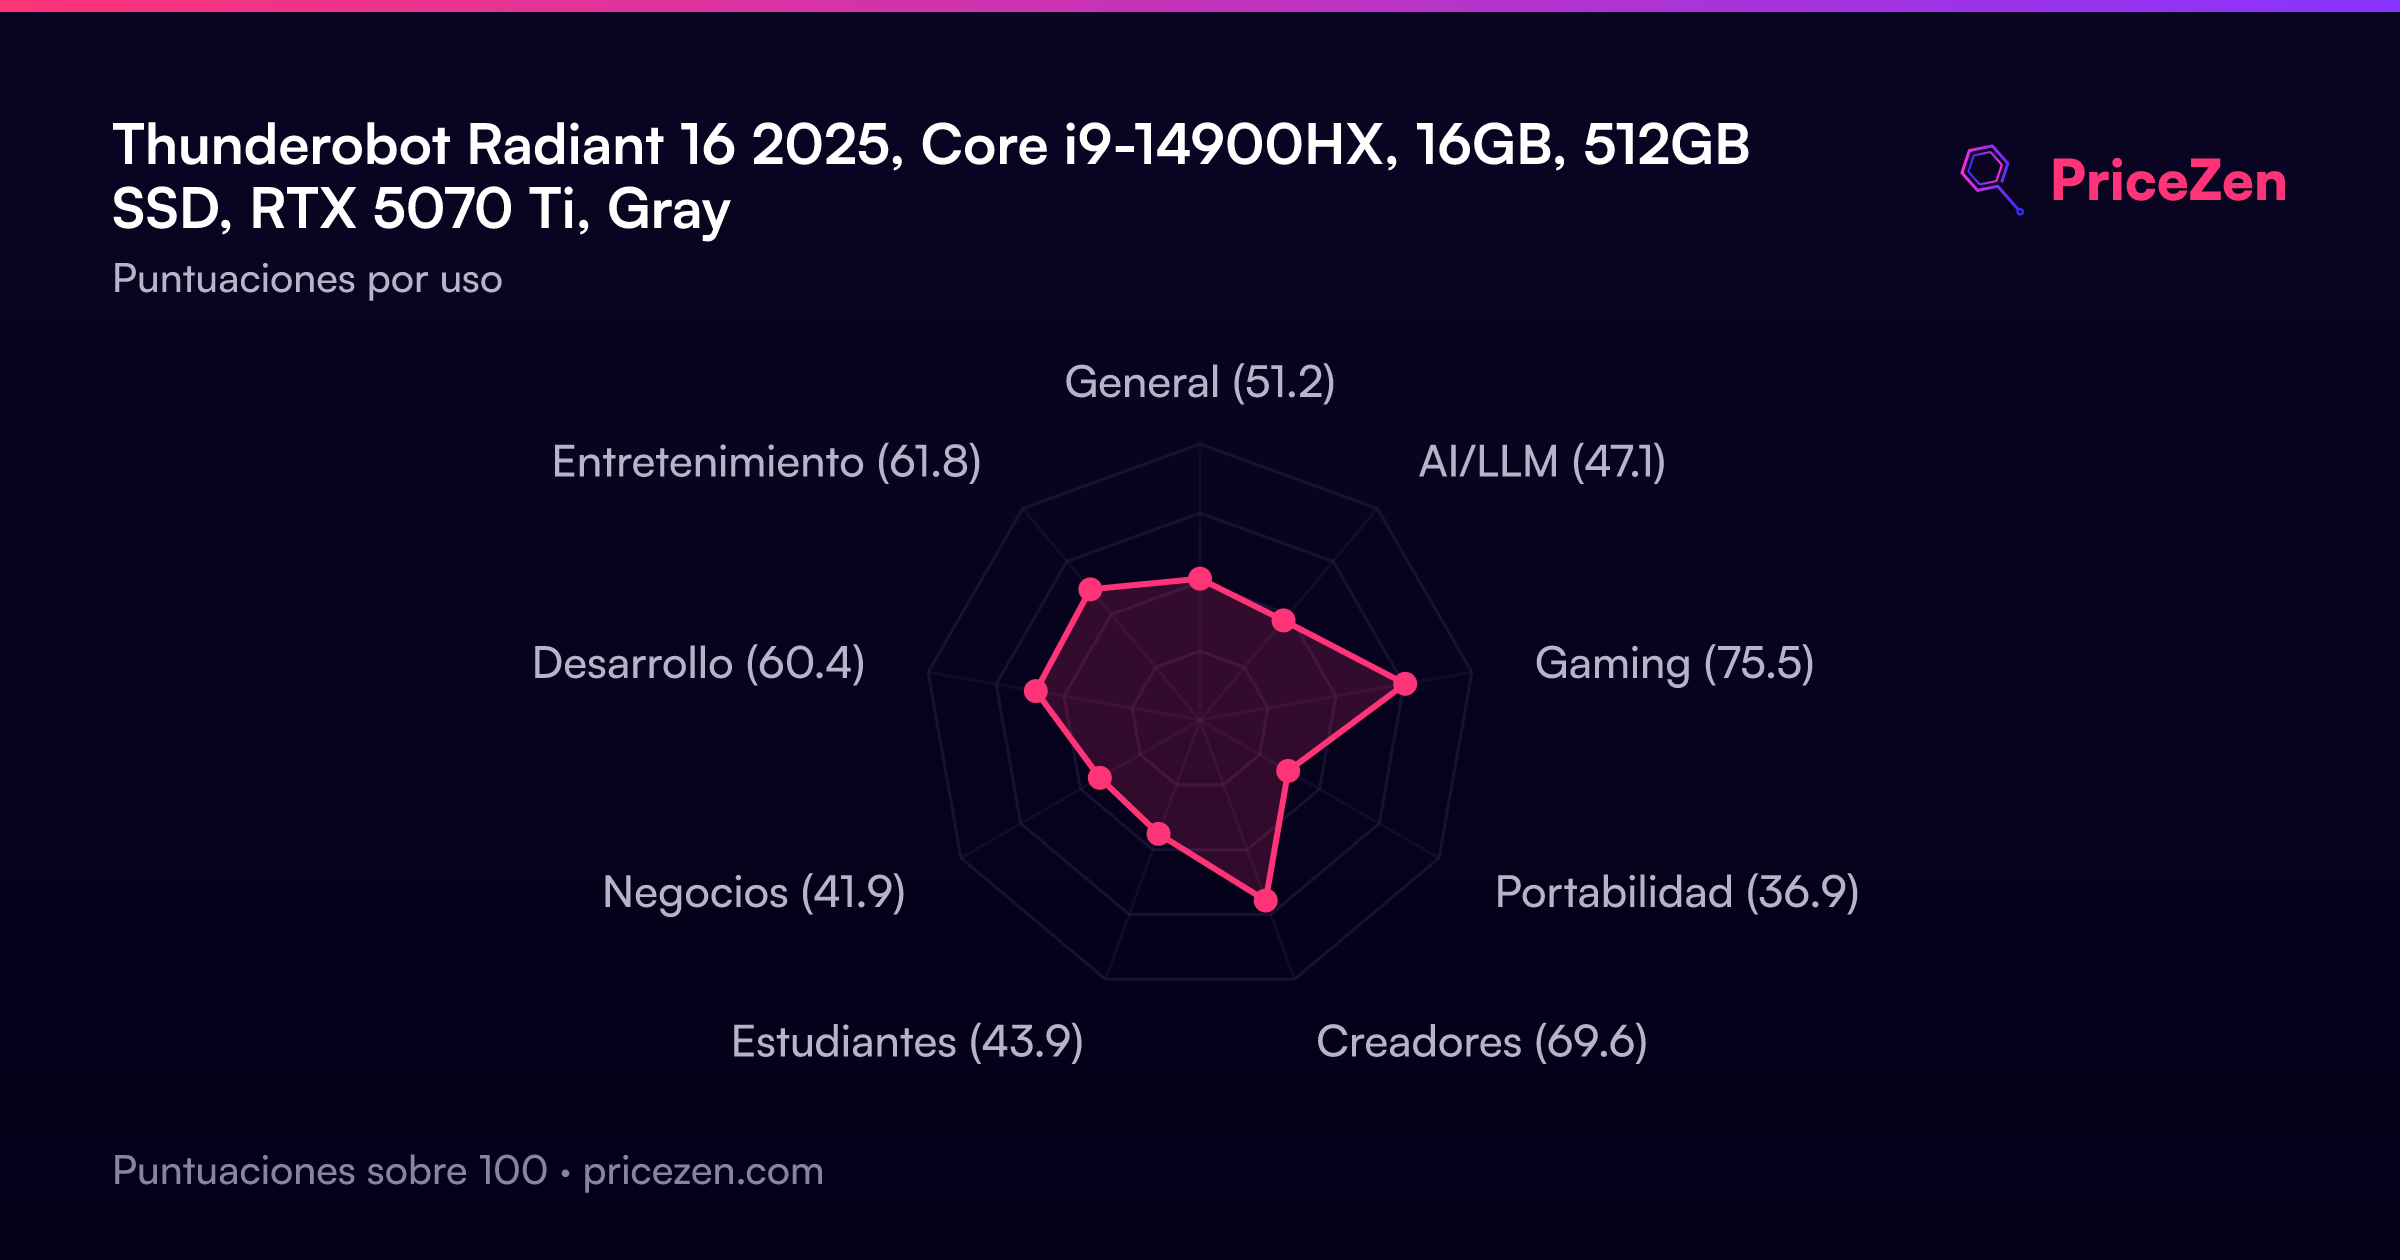
Puntuaciones por uso
- General51.2
- AI/LLM47.1
- Gaming75.5
- Portabilidad36.9
- Creadores69.6
- Estudiantes43.9
- Negocios41.9
- Desarrollo60.4
- Entretenimiento61.8
Pronto habrá un análisis completo. Las especificaciones, puntuaciones, precios y gráficos de arriba siempre están actualizados.
Otras configuraciones16
Radiant 16Intel Core i7 14650HX16GB1TBGray1149 US$Radiant 16Intel Core i7 14650HX32GB1TBGray1299 US$Radiant 16Intel Core i7 14650HX32GB2TBBlack1399 US$Radiant 16Intel Core i9 14900HX32GB1TBGray1519 US$Radiant 16Intel Core i9 13900HX16GB1TBBlack1639 US$Radiant 16Intel Core i7 14650HX64GB2TBBlack1699 US$Radiant 16Intel Core i9 14900HX32GB2TBGray1809 US$Radiant 16Intel Core i9 14900HX32GB1TBGray1949 US$Radiant 16Intel Core i9 13900HX32GB1TBGray2129 US$
Ver las 16 configuraciones
Radiant 16Intel Core i9 14900HX64GB2TBGray2169 US$Radiant 16Intel Core i9 14900HX32GB2TBBlack2199 US$Radiant 16Intel Core i9 14900HX64GB4TBGray2459 US$Radiant 16Intel Core i9 13900HX32GB1TBBlackRadiant 16Intel Core i9 14900HX16GB1TBGrayRadiant 16Intel Core i9 14900HX16GB1TBGreyRadiant 16Intel Core i9 14900HX32GB1TBGrey