Thunderobot Radiant 16, Core i9-13900HX, 16GB, 1TB SSD, RTX 5070 Ti, Black
The Core i9-13900HX and RTX 5070 Ti combination drives a 2560x1600 300Hz display with GPU direct output for esports-level clarity. Its 2.5K panel offers pro-grade color accuracy, while the durable chassis houses advanced cooling for sustained loads. This machine is best for competitive gamers who need high refresh rate precision and creators running GPU-accelerated rendering tasks.
CPU Intel Core i9 13900HX
RAM 16 GB
Storage 1 TB
Screen 16" 2560x1600
GPU NVIDIA GeForce RTX 5070 Ti
OS Windows 11 Home
Weight 2.1 kg

55 Puntuación global
Sin precio actual de tiendas
Resumen
Ventajas y desventajas
Ventajas
- Strong gpu (97th percentile) 97th
- Strong cpu (93rd percentile) 93rd
- Strong screen (87th percentile) 87th
- Strong storage (79th percentile) 79th
Desventajas
- Below average reliability (4th percentile)
- Below average portability (18th percentile)
- Below average affordability (24th percentile)
Las pruebas
Rendimiento
Especificaciones
Especificaciones completas
Processor
| CPU | Intel Core i9 13900HX |
| Cores | 24 |
| Frequency | 1.6 GHz |
| L3 Cache | 36 MB |
Graphics
| GPU | NVIDIA GeForce RTX 5070 Ti |
| Type | Discrete |
| VRAM | 12 GB |
| VRAM Type | GDDR7 |
Memory & Storage
| RAM | 16 GB |
| RAM Generation | DDR5 |
| Storage | 1 TB |
| Storage Type | NVMe SSD |
Display
| Size | 16" |
| Resolution | 2560x1600 (QHD) |
| Refresh Rate | 300 Hz |
Connectivity
| USB-C Ports | 1 |
| USB Ports | 3 |
| HDMI | 1 x HDMI |
| Wi-Fi | Wi-Fi 6 |
| Bluetooth | Yes |
| Ethernet | RJ-45 |
Physical
| Weight | 2.1 kg / 4.6 lbs |
| OS | Windows 11 Home |
Frente a la competencia
| Spec | Thunderobot Radiant 16 | Apple MacBook Pro 14.2" M4 Max | ASUS ROG Zephyrus 14" GA403WW-G14.R95080 | Lenovo Legion Pro 7i Gen 10 16" | HP OMEN Transcend | Samsung Galaxy Book5 Pro 14" NP944XHA-KG3US |
|---|---|---|---|---|---|---|
| CPU | Intel Core i9 13900HX | Apple M4 Max | AMD Ryzen AI 9 HX 370 | Intel Core Ultra 9 275HX | Intel Core Ultra 9 285H | Intel Core Ultra 7 258V |
| RAM (GB) | 16 | 64 | 32 | 32 | 32 | 32 |
| Storage (GB) | 1024 | 4096 | 2048 | 1024 | 1024 | 1024 |
| Screen | 16" 2560x1600 | 14.2" 3024x1964 | 14" 2880x1800 | 16" 2560x1600 | 14" 2880x1800 | 14" 2880x1800 |
| GPU | NVIDIA GeForce RTX 5070 Ti | Apple (40-Core) | NVIDIA GeForce RTX 5080 | NVIDIA GeForce RTX 5070 Ti | NVIDIA GeForce RTX 5070 | Intel Arc Graphics 140V |
| OS | Windows 11 Home | macOS | Windows 11 Home | Windows 11 Home | Windows 11 Home | Windows 11 Pro |
| Weight (kg) | 2.1 | 1.6 | 1.6 | 2.7 | 1.6 | 1.2 |
| Battery (Wh) | - | 72 | - | 99 | 71 | 63 |
| Compare | Compare | Compare | Compare | Compare |
| Producto | CPU | GPU | RAM | Puertos | Pantalla | Portabilidad | Almacenamiento | Fiabilidad | Affordability |
|---|---|---|---|---|---|---|---|---|---|
| Thunderobot Radiant 16 | 92.7 | 96.6 | 49.8 | 60.4 | 87.4 | 17.6 | 79.2 | 4 | 23.5 |
| Apple MacBook Pro 14.2" M4 Max Compare | 93.7 | 91.6 | 95.7 | 73.2 | 99.3 | 68.9 | 98.5 | 98.3 | 1.7 |
| ASUS ROG Zephyrus 14" GA403WW-G14.R95080 Compare | 91.2 | 98.3 | 90.9 | 89.2 | 96.5 | 73.6 | 89.7 | 60.6 | 5.7 |
| Lenovo Legion Pro 7i Gen 10 16" Compare | 97.2 | 96.6 | 89 | 97.2 | 95.6 | 9.5 | 79.2 | 82.1 | 5.5 |
| HP OMEN Transcend Compare | 90.1 | 93.6 | 89.7 | 89.2 | 96.5 | 72.3 | 65.1 | 33.6 | 8.3 |
| Samsung Galaxy Book5 Pro 14" NP944XHA-KG3US Compare | 65.7 | 69.6 | 79.4 | 83.1 | 91.5 | 89.5 | 79.2 | 82.1 | 20.1 |
Precio
Relación calidad-precio
Historial de precios
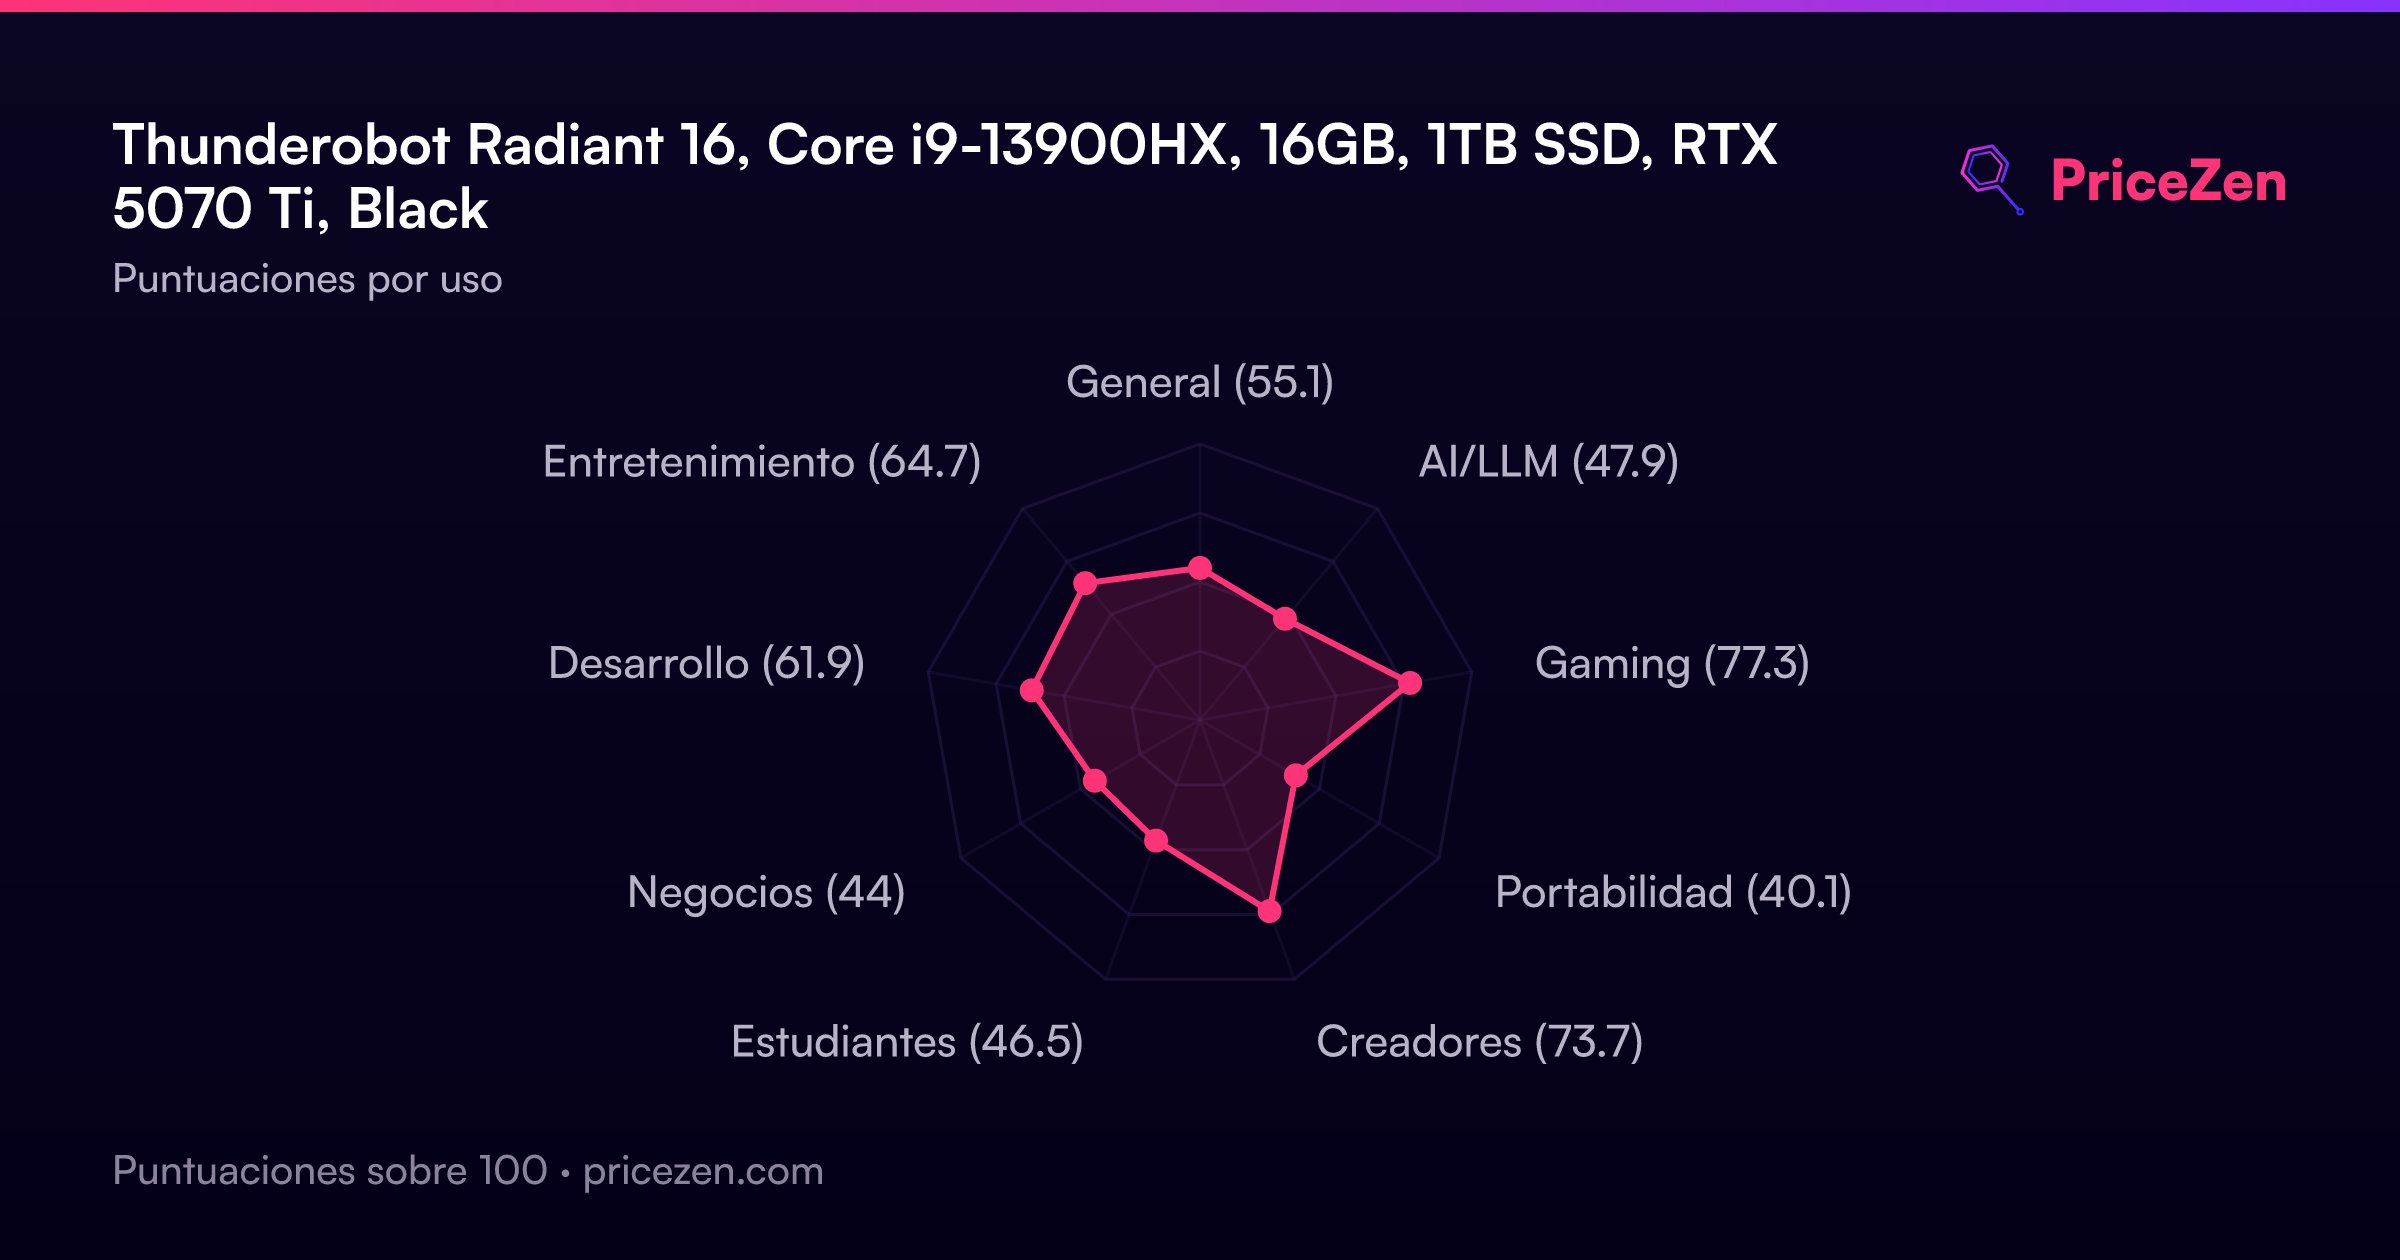
Puntuaciones por uso
- General55.1
- AI/LLM47.9
- Gaming77.3
- Portabilidad40.1
- Creadores73.7
- Estudiantes46.5
- Negocios44
- Desarrollo61.9
- Entretenimiento64.7
Pronto habrá un análisis completo. Las especificaciones, puntuaciones, precios y gráficos de arriba siempre están actualizados.
Otras configuraciones16
Radiant 16Intel Core i7 14650HX16GB1TBGray1149 US$Radiant 16Intel Core i7 14650HX32GB1TBGray1299 US$Radiant 16Intel Core i7 14650HX32GB2TBBlack1399 US$Radiant 16Intel Core i9 14900HX32GB1TBGray1519 US$Radiant 16Intel Core i9 14900HX16GB512GBGray1699 US$Radiant 16Intel Core i7 14650HX64GB2TBBlack1699 US$Radiant 16Intel Core i9 14900HX32GB2TBGray1809 US$Radiant 16Intel Core i9 14900HX32GB1TBGray1949 US$Radiant 16Intel Core i9 13900HX32GB1TBGray2129 US$
Ver las 16 configuraciones
Radiant 16Intel Core i9 14900HX64GB2TBGray2169 US$Radiant 16Intel Core i9 14900HX32GB2TBBlack2199 US$Radiant 16Intel Core i9 14900HX64GB4TBGray2459 US$Radiant 16Intel Core i9 13900HX32GB1TBBlackRadiant 16Intel Core i9 14900HX16GB1TBGrayRadiant 16Intel Core i9 14900HX16GB1TBGreyRadiant 16Intel Core i9 14900HX32GB1TBGrey