ASUS Vivobook 16" M1607KA-DS54 2025, Ryzen AI 5 340, 16GB, 512GB SSD, Quiet Blue
CPU AMD Ryzen AI 5 340
RAM 16 GB
Storage 512 GB
Screen 16"
GPU AMD Radeon integrados
OS Windows 11

35 Puntuación global
Sin precio actual de tiendas


Resumen
Ventajas y desventajas
Ventajas
- Strong affordability (76th percentile) 76th
- Strong cpu (69th percentile) 69th
Desventajas
- Below average gpu (7th percentile)
- Below average port selection (15th percentile)
- Below average portability (19th percentile)
Las pruebas
Rendimiento
Especificaciones
Especificaciones completas
Processor
| CPU | AMD Ryzen AI 5 340 |
| Cores | 6 |
Graphics
| GPU | AMD Radeon integrados |
Memory & Storage
| RAM | 16 GB |
| Storage | 512 GB |
| Storage Type | SSD |
Display
| Size | 16" |
| Panel | IPS |
| Refresh Rate | 60 Hz |
| Brightness | 300 nits |
| Color Gamut | 100% sRGB |
Connectivity
| Wi-Fi | Wi-Fi 6 |
| Bluetooth | Bluetooth 5.3 |
Physical
| OS | Windows 11 |
Frente a la competencia
| Spec | ASUS Vivobook 16" M1607KA-DS54 | Apple MacBook Pro 14.2" M4 Max | Lenovo Legion Pro 7i 16" | HP ZBook 14" Ultra G1a | MSI Vector VECTOR16HXA2400 | Samsung Galaxy Book5 Pro 360 16" NP964QHA-KG2US |
|---|---|---|---|---|---|---|
| CPU | AMD Ryzen AI 5 340 | Apple M4 Max | Intel Core Ultra 9 275HX | AMD Ryzen AI Max Pro 390 | Intel Core Ultra 9 275HX | Intel Core Ultra 7 258V |
| RAM (GB) | 16 | 64 | 32 | 64 | 16 | 32 |
| Storage (GB) | 512 | 4096 | 1024 | 4096 | 1024 | 1024 |
| Screen | 16" | 14.2" 3024x1964 | 16" 2560x1600 | 14" 1920x1200 | 16" 2560x1600 | 16" 2880x1800 |
| GPU | AMD Radeon integrados | Apple (40-Core) | NVIDIA GeForce RTX 5090 | AMD Radeon 8050S | NVIDIA GeForce RTX 5080 | Intel Arc 140V |
| OS | Windows 11 | macOS | Windows 11 Home | Windows 11 Pro | Windows 11 Home | Windows 11 Pro |
| Weight (kg) | - | 1.6 | 2.7 | 2.5 | 2.7 | 1.7 |
| Battery (Wh) | - | 72 | 100 | 74 | - | 76 |
| Compare | Compare | Compare | Compare | Compare |
| Producto | CPU | GPU | RAM | Puertos | Pantalla | Portabilidad | Almacenamiento | Fiabilidad | Affordability |
|---|---|---|---|---|---|---|---|---|---|
| ASUS Vivobook 16" M1607KA-DS54 | 69.3 | 6.5 | 36.2 | 14.8 | 52.8 | 19.4 | 35.6 | 60.7 | 76.4 |
| Apple MacBook Pro 14.2" M4 Max Compare | 93.7 | 91.6 | 95.7 | 73.1 | 99.3 | 68.8 | 98.4 | 98.3 | 1.7 |
| Lenovo Legion Pro 7i 16" Compare | 97.2 | 99.5 | 89 | 97.2 | 95.6 | 9.7 | 93.9 | 82.1 | 1.3 |
| HP ZBook 14" Ultra G1a Compare | 92.8 | 86.1 | 99.2 | 79.7 | 74 | 61.7 | 98.4 | 33.6 | 3 |
| MSI Vector VECTOR16HXA2400 Compare | 97.2 | 98.3 | 59.6 | 89.2 | 90 | 10 | 65.2 | 60.7 | 8.9 |
| Samsung Galaxy Book5 Pro 360 16" NP964QHA-KG2US Compare | 65.7 | 65.9 | 79.4 | 63.6 | 94.8 | 33.2 | 88.6 | 82.1 | 20.9 |
Precio
Relación calidad-precio
Seguimos los precios de este producto desde el 19 jul 2026. El gráfico aparecerá cuando tengamos más datos.
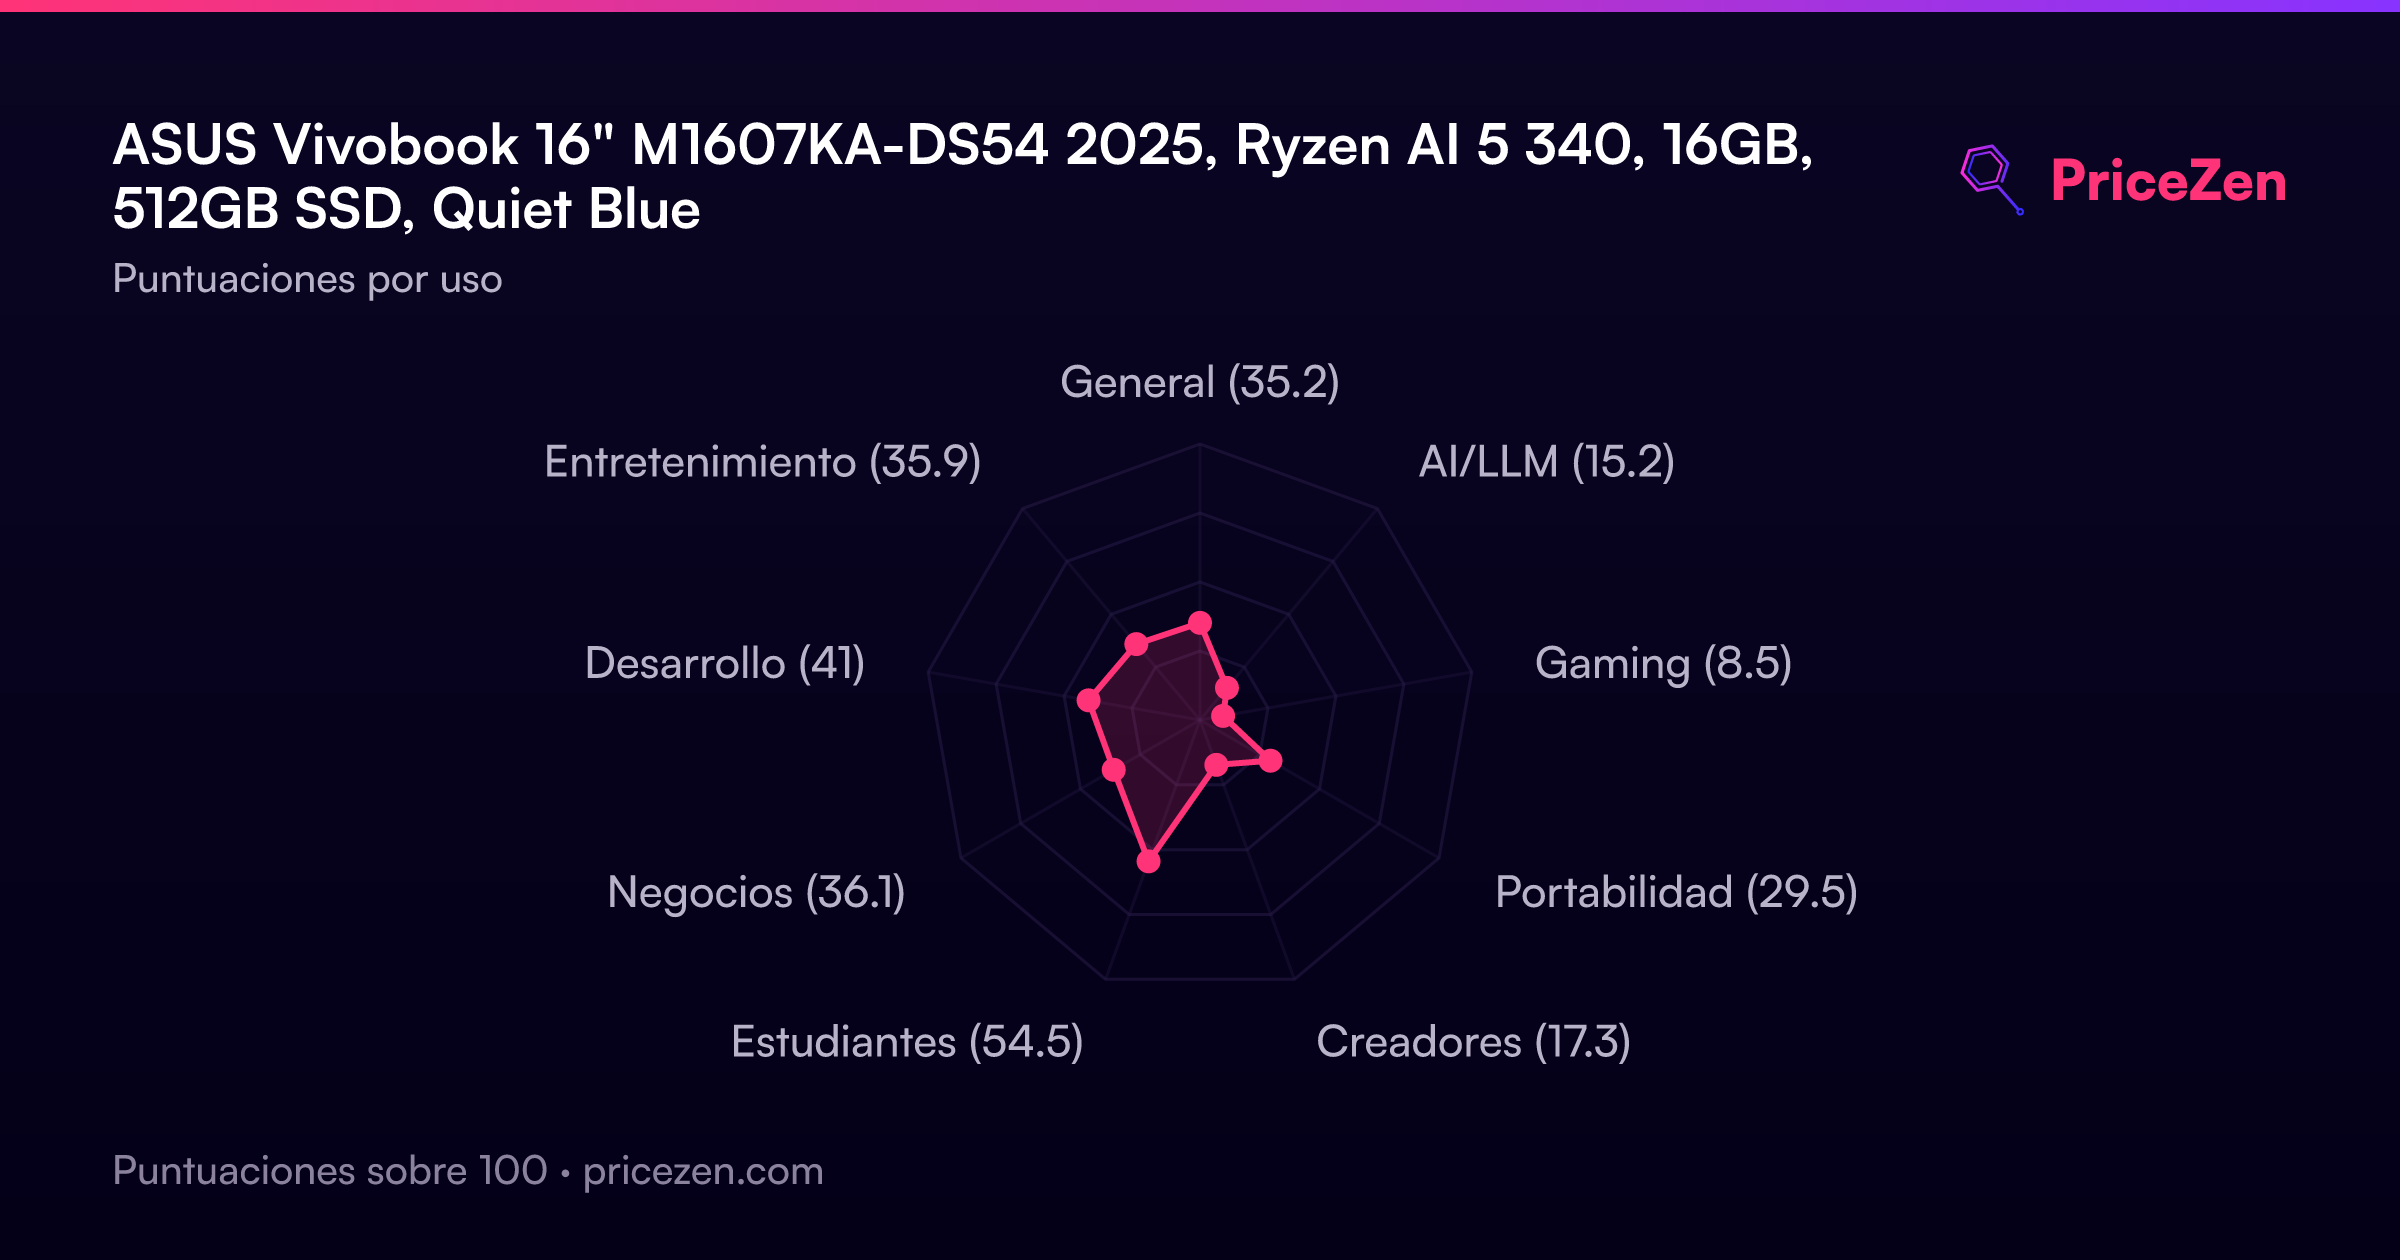
Puntuaciones por uso
- General35.2
- AI/LLM15.2
- Gaming8.5
- Portabilidad29.5
- Creadores17.3
- Estudiantes54.5
- Negocios36.1
- Desarrollo41
- Entretenimiento35.9
Pronto habrá un análisis completo. Las especificaciones, puntuaciones, precios y gráficos de arriba siempre están actualizados.
Otras configuraciones14
VivoBook 16" M1607KA-NS76AMD Ryzen AI 7 35016GB512GBBlack18.538 MXNVivobook 16 M1607AMD Ryzen AI 7 35016GB1TBQuiet Blue19.209 MXNVivobook 16" M1607GA-DS76AMD Ryzen AI 7 44516GB1TBQuiet Blue35.249 MXNVivobook 16" M1607KA-DS54AMD Ryzen AI 5 34016GB512GBQuiet BlueVivoBook 16" M1607KA-NS76AMD Ryzen AI 7 35024GB512GBBlackVivobook 16" M1607KA-SS71-CBAMD Ryzen AI 7 35016GB512GBVivobook 16" M1607KA-OS51AMD Ryzen AI 5 34016GB512GBQuiet BlueVivobook 16" M1607KA-DS52-CBAMD Ryzen AI 5 34016GB1TBQuiet BlueVivobook 16" M1607KA-BS72-CBAMD Ryzen AI 7 35032GB1TB
Ver las 14 configuraciones
Vivobook 16" M1607KA-BS52-CBAMD Ryzen AI 5 33032GB512GBQuiet BlueVivobook 16" M1607KA-BS73-CBAMD Ryzen AI 7 35032GB1TBQuiet BlueVivobook 16 M1607KAAMD Ryzen AI 5 33032GB1TBQuiet BlueVivobook 16" M1607KA-V16.R516512AMD Ryzen AI 5 33016GB512GBQuiet BlueVivobook 16" M1607KA-OS51AMD Ryzen AI 5 34016GB1TBQuiet Blue