Nuevo
Transcend MTS825 500GB SATA III M.2 2280
Capacity 500GB
Form Factor M.2 2280
Interface SATA III
Read Speed 530 MB/s
NAND TLC
Endurance 180 TBW

41 Puntuación global
Precio 96 US$ Normalmente 96 US$ · una tienda, 73 días de precios


Resumen
Ventajas y desventajas
Ventajas
- Strong affordability (76th percentile) 76th
- Strong social proof (75th percentile) 75th
- Strong endurance (71st percentile) 71st
Desventajas
- Below average speed (23rd percentile)
- Below average capacity (27th percentile)
Las pruebas
Rendimiento
Especificaciones
Especificaciones completas
Drive
| Capacity | 500 |
| Form Factor | M.2 2280 |
| Interface | SATA III |
| Protocol | SATA |
| External | No |
Performance
| Sequential Read (MB/s) | 530 |
| Sequential Write (MB/s) | 480 |
| Random Read (IOPS) | 55000 |
| Random Write (IOPS) | 75000 |
Hardware
| NAND | TLC |
| DRAM Cache | No |
Reliability
| Endurance (TBW) | 180 |
| MTBF (hours) | 2000000 |
| Warranty (years) | 3 |
Frente a la competencia
| Spec | Transcend MTS825 | Western Digital WD_BLACK SN8100 | Samsung 9100 PRO | Crucial T500 | MSI SPATIUM M480 PRO | Kingston FURY Renegade G5 |
|---|---|---|---|---|---|---|
| Capacity | 500GB | 1TB | 1TB | 1TB | 1TB | 1TB |
| Form Factor | M.2 2280 | M.2 2280 | M.2 2280 | M.2 2280 | M.2 2280 | M.2 2280 |
| Interface | SATA III | PCIe 5.0 x4 | PCIe 5.0 x4 | PCIe 4.0 x4 | PCIe 4.0 x4 | PCIe 5.0 x4 |
| Seq Read | 530 MB/s | 14,900 MB/s | 14,700 MB/s | 7,300 MB/s | 7,400 MB/s | 14,200 MB/s |
| Nand Type | TLC | TLC | TLC | TLC | TLC | TLC |
| Dram Cache | false | true | true | true | true | true |
| Endurance | 180 TBW | 600 TBW | 600 TBW | 600 TBW | 3000 TBW | 1000 TBW |
| Compare | Compare | Compare | Compare | Compare |
| Producto | Speed | Random | Feature | Capacity | Endurance | Valoración social | Affordability |
|---|---|---|---|---|---|---|---|
| Transcend MTS825 | 22.7 | 40.3 | 52.8 | 26.9 | 71.1 | 75.1 | 76.2 |
| Western Digital WD_BLACK SN8100 Compare | 97.8 | 98.7 | 99.7 | 55.4 | 80.3 | 94.9 | 38.9 |
| Samsung 9100 PRO Compare | 98.8 | 99.8 | 99.7 | 55.4 | 85.6 | 99.6 | 42.1 |
| Crucial T500 Compare | 91.3 | 96.7 | 98.9 | 55.4 | 82.5 | 94.9 | 52 |
| MSI SPATIUM M480 PRO Compare | 94 | 80.9 | 93.9 | 55.4 | 98.5 | 94.9 | 41.3 |
| Kingston FURY Renegade G5 Compare | 97.4 | 99 | 90.7 | 55.4 | 92.4 | 85.8 | 35 |
Precio
Relación calidad-precio
Desde 96 US$
Amazon 1 oferta Desde 96 US$
Historial de precios
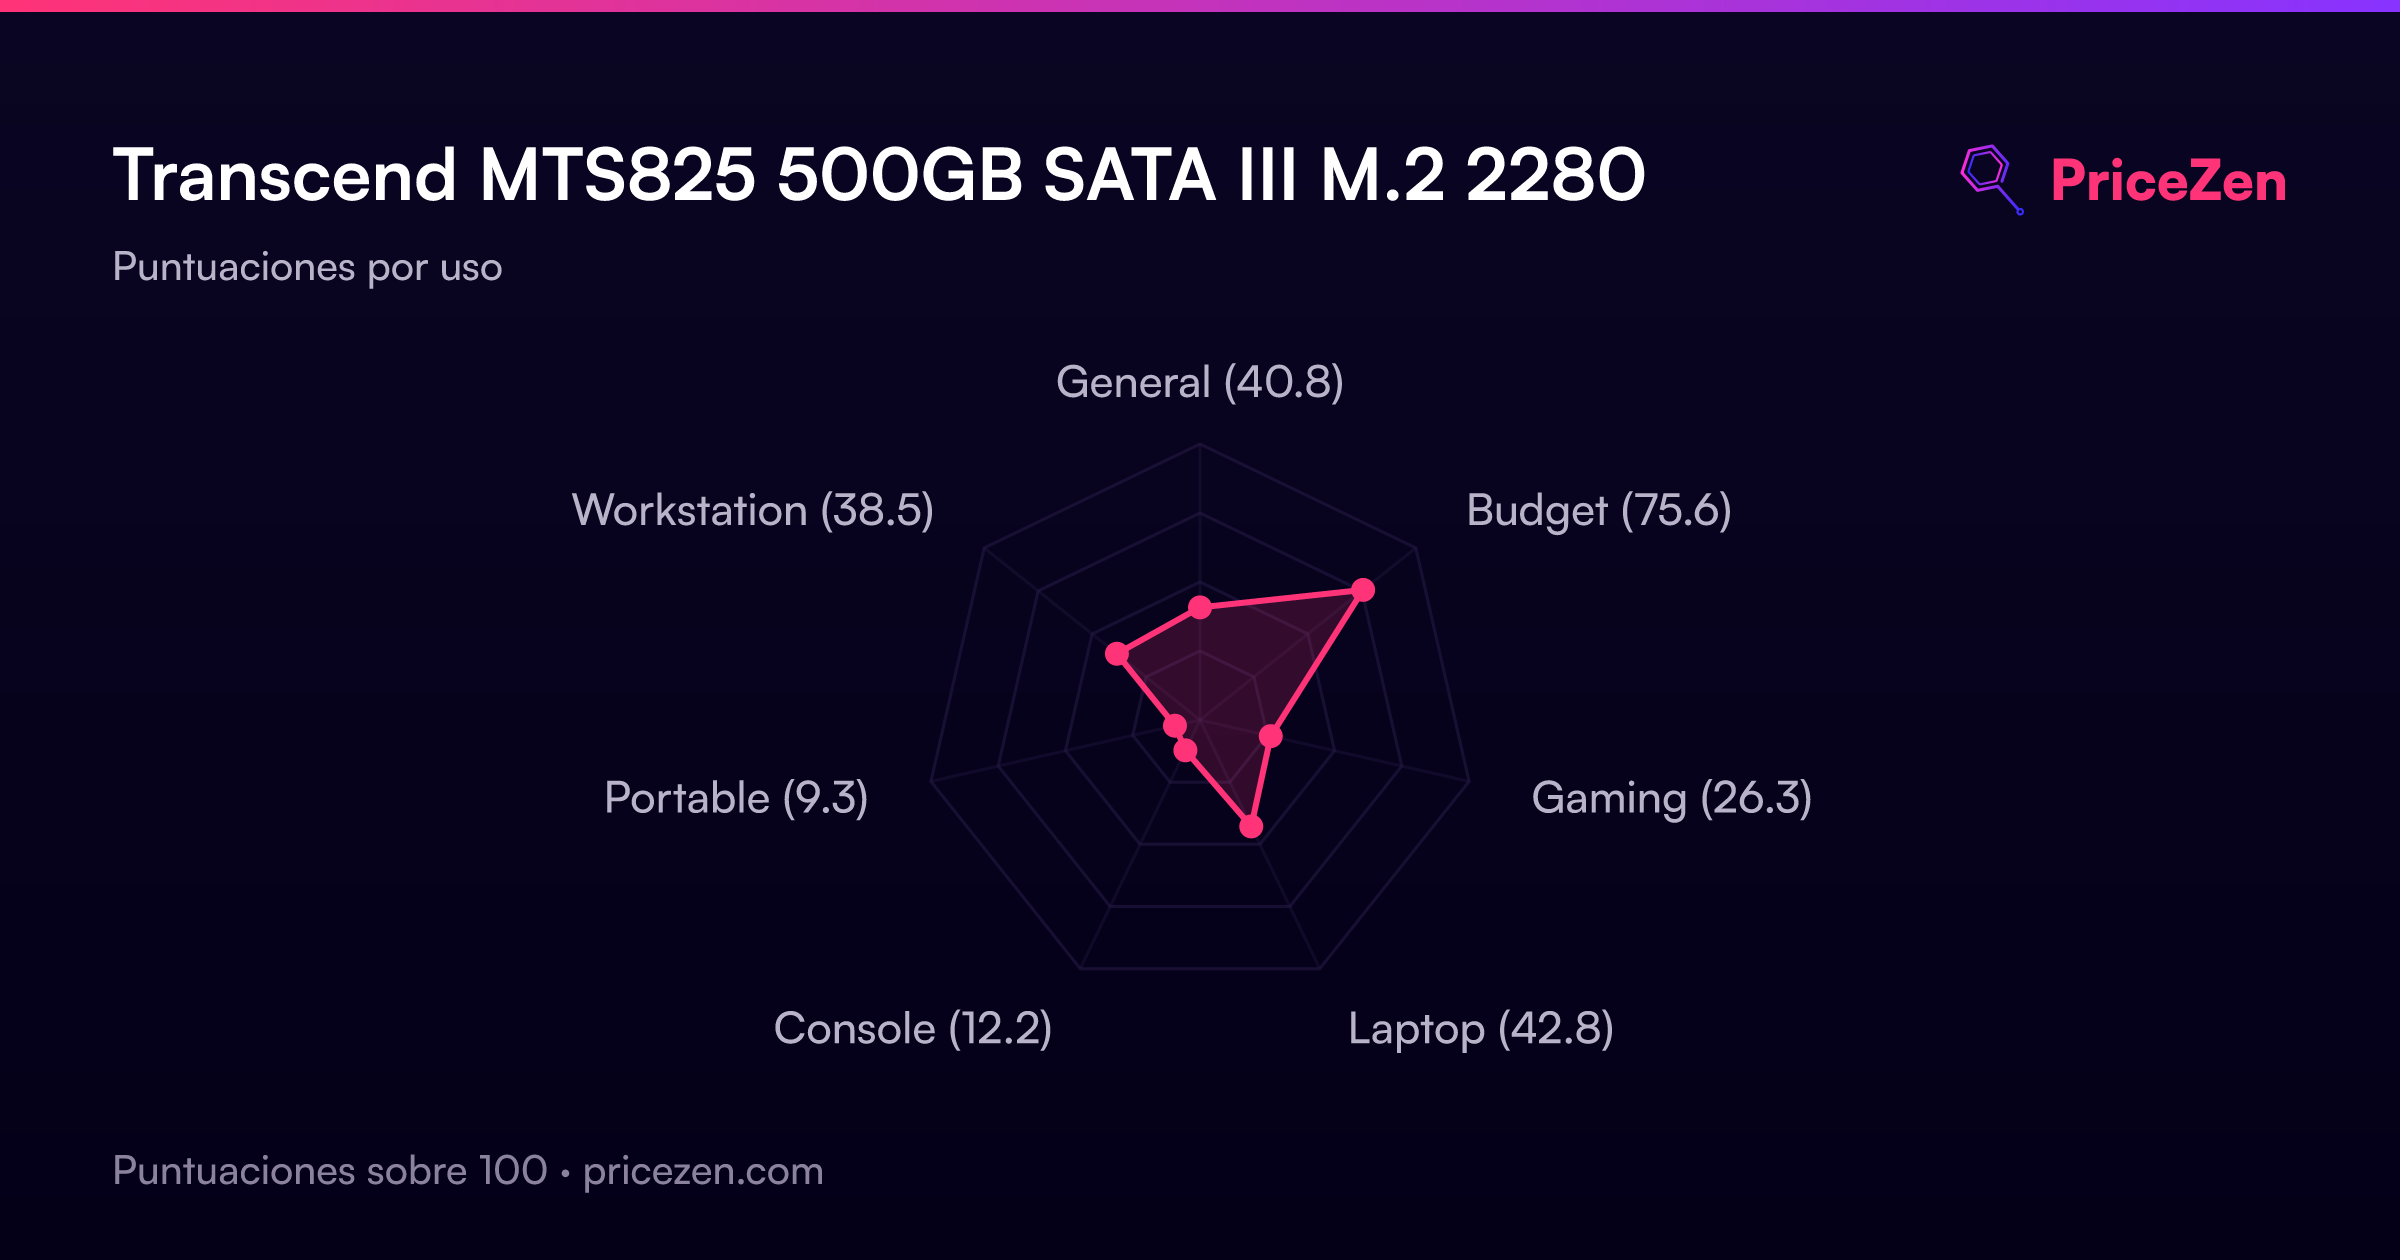
Puntuaciones por uso
- General40.8
- Budget75.4
- Gaming26.3
- Laptop42.8
- Console12.2
- Portable9.3
- Workstation38.5
Pronto habrá un análisis completo. Las especificaciones, puntuaciones, precios y gráficos de arriba siempre están actualizados.