Nuevo
Gigabyte A16 CMHI2US893SH 2025, Core i7-13620H, 16GB, 512GB SSD, RTX 4050, Black
CPU Intel Core i7 13620H
RAM 16 GB
Storage 512 GB
Screen 16"
GPU NVIDIA GeForce RTX 4050
OS Windows 11 Home
Weight 2.2 kg
Battery 76 Wh

49 Puntuación global
Precio 1019 US$ Normalmente 1019 US$ · una tienda, 88 días de precios
Resumen
Ventajas y desventajas
Ventajas
- Strong gpu (84th percentile) 84th
- Strong cpu (75th percentile) 75th
- Strong screen (72nd percentile) 72nd
- Strong port selection (68th percentile) 68th
Desventajas
- Below average reliability (4th percentile)
- Below average portability (16th percentile)
Las pruebas
Rendimiento
Especificaciones
Especificaciones completas
Processor
| CPU | Intel Core i7 13620H |
| Cores | 10 |
| Frequency | 2.4 GHz |
| L3 Cache | 24 MB |
Graphics
| GPU | NVIDIA GeForce RTX 4050 |
| Type | Discrete |
| VRAM | 6 GB |
| VRAM Type | GDDR6 |
Memory & Storage
| RAM | 16 GB |
| RAM Generation | DDR5 |
| Storage | 512 GB |
| Storage Type | NVMe SSD |
Display
| Size | 16" |
| Panel | IPS |
| Refresh Rate | 165 Hz |
| Brightness | 300 nits |
| Color Gamut | 45% NTSC |
Connectivity
| USB-C Ports | 1 |
| USB Ports | 3 |
| HDMI | HDMI v2.1 |
| Wi-Fi | Wi-Fi 6E |
| Bluetooth | Bluetooth 5.2 |
| Ethernet | 10/100/1000Mbps LAN |
Physical
| Weight | 2.2 kg / 4.9 lbs |
| Battery | 76 Wh |
| OS | Windows 11 Home |
Frente a la competencia
| Spec | Gigabyte A16 CMHI2US893SH | Apple MacBook Air 13.6" M4 | Lenovo Legion Pro 7i Gen 10 16" | ASUS ROG Flow 13.4" GZ302EA-R9641TB | HP OMEN Transcend | Samsung Galaxy Book5 Pro 14" NP944XHA-KG3US |
|---|---|---|---|---|---|---|
| CPU | Intel Core i7 13620H | Apple M4 | Intel Core Ultra 9 275HX | AMD Ryzen AI Max+ 395 | Intel Core Ultra 9 285H | Intel Core Ultra 7 258V |
| RAM (GB) | 16 | 24 | 32 | 64 | 32 | 32 |
| Storage (GB) | 512 | 1024 | 1024 | 1024 | 1024 | 1024 |
| Screen | 16" | 13.6" 2560x1664 | 16" 2560x1600 | 13.4" 2560x1600 | 14" 2880x1800 | 14" 2880x1800 |
| GPU | NVIDIA GeForce RTX 4050 | Apple (10-Core) | NVIDIA GeForce RTX 5070 Ti | AMD Radeon Graphics | NVIDIA GeForce RTX 5070 | Intel Arc Graphics 140V |
| OS | Windows 11 Home | macOS | Windows 11 Home | Windows 11 Home | Windows 11 Home | Windows 11 Pro |
| Weight (kg) | 2.2 | 1.2 | 2.7 | 1.2 | 1.6 | 1.2 |
| Battery (Wh) | 76 | 54 | 99 | 70 | 71 | 63 |
| Compare | Compare | Compare | Compare | Compare |
| Producto | CPU | GPU | RAM | Puertos | Pantalla | Portabilidad | Almacenamiento | Fiabilidad | Affordability |
|---|---|---|---|---|---|---|---|---|---|
| Gigabyte A16 CMHI2US893SH | 74.8 | 83.9 | 55.6 | 67.6 | 71.5 | 16 | 50.9 | 4 | 43 |
| Apple MacBook Air 13.6" M4 Compare | 75.9 | 75.7 | 64.9 | 50.9 | 87 | 91.4 | 79.2 | 98.3 | 24.6 |
| Lenovo Legion Pro 7i Gen 10 16" Compare | 97.2 | 96.6 | 89 | 97.2 | 95.6 | 9.5 | 79.2 | 82 | 5.5 |
| ASUS ROG Flow 13.4" GZ302EA-R9641TB Compare | 95.8 | 91.8 | 99.1 | 77.2 | 88.8 | 94.3 | 65.2 | 60.6 | 10.4 |
| HP OMEN Transcend Compare | 90.1 | 93.6 | 89.7 | 89.2 | 96.5 | 72.2 | 65.2 | 33.6 | 8.3 |
| Samsung Galaxy Book5 Pro 14" NP944XHA-KG3US Compare | 65.8 | 69.7 | 79.5 | 83.1 | 91.5 | 89.5 | 79.2 | 82 | 20 |
Precio
Relación calidad-precio
Desde 1019 US$
Amazon 1 oferta Desde 1019 US$
Seguimos los precios de este producto desde el 20 nov 2026. El gráfico aparecerá cuando tengamos más datos.
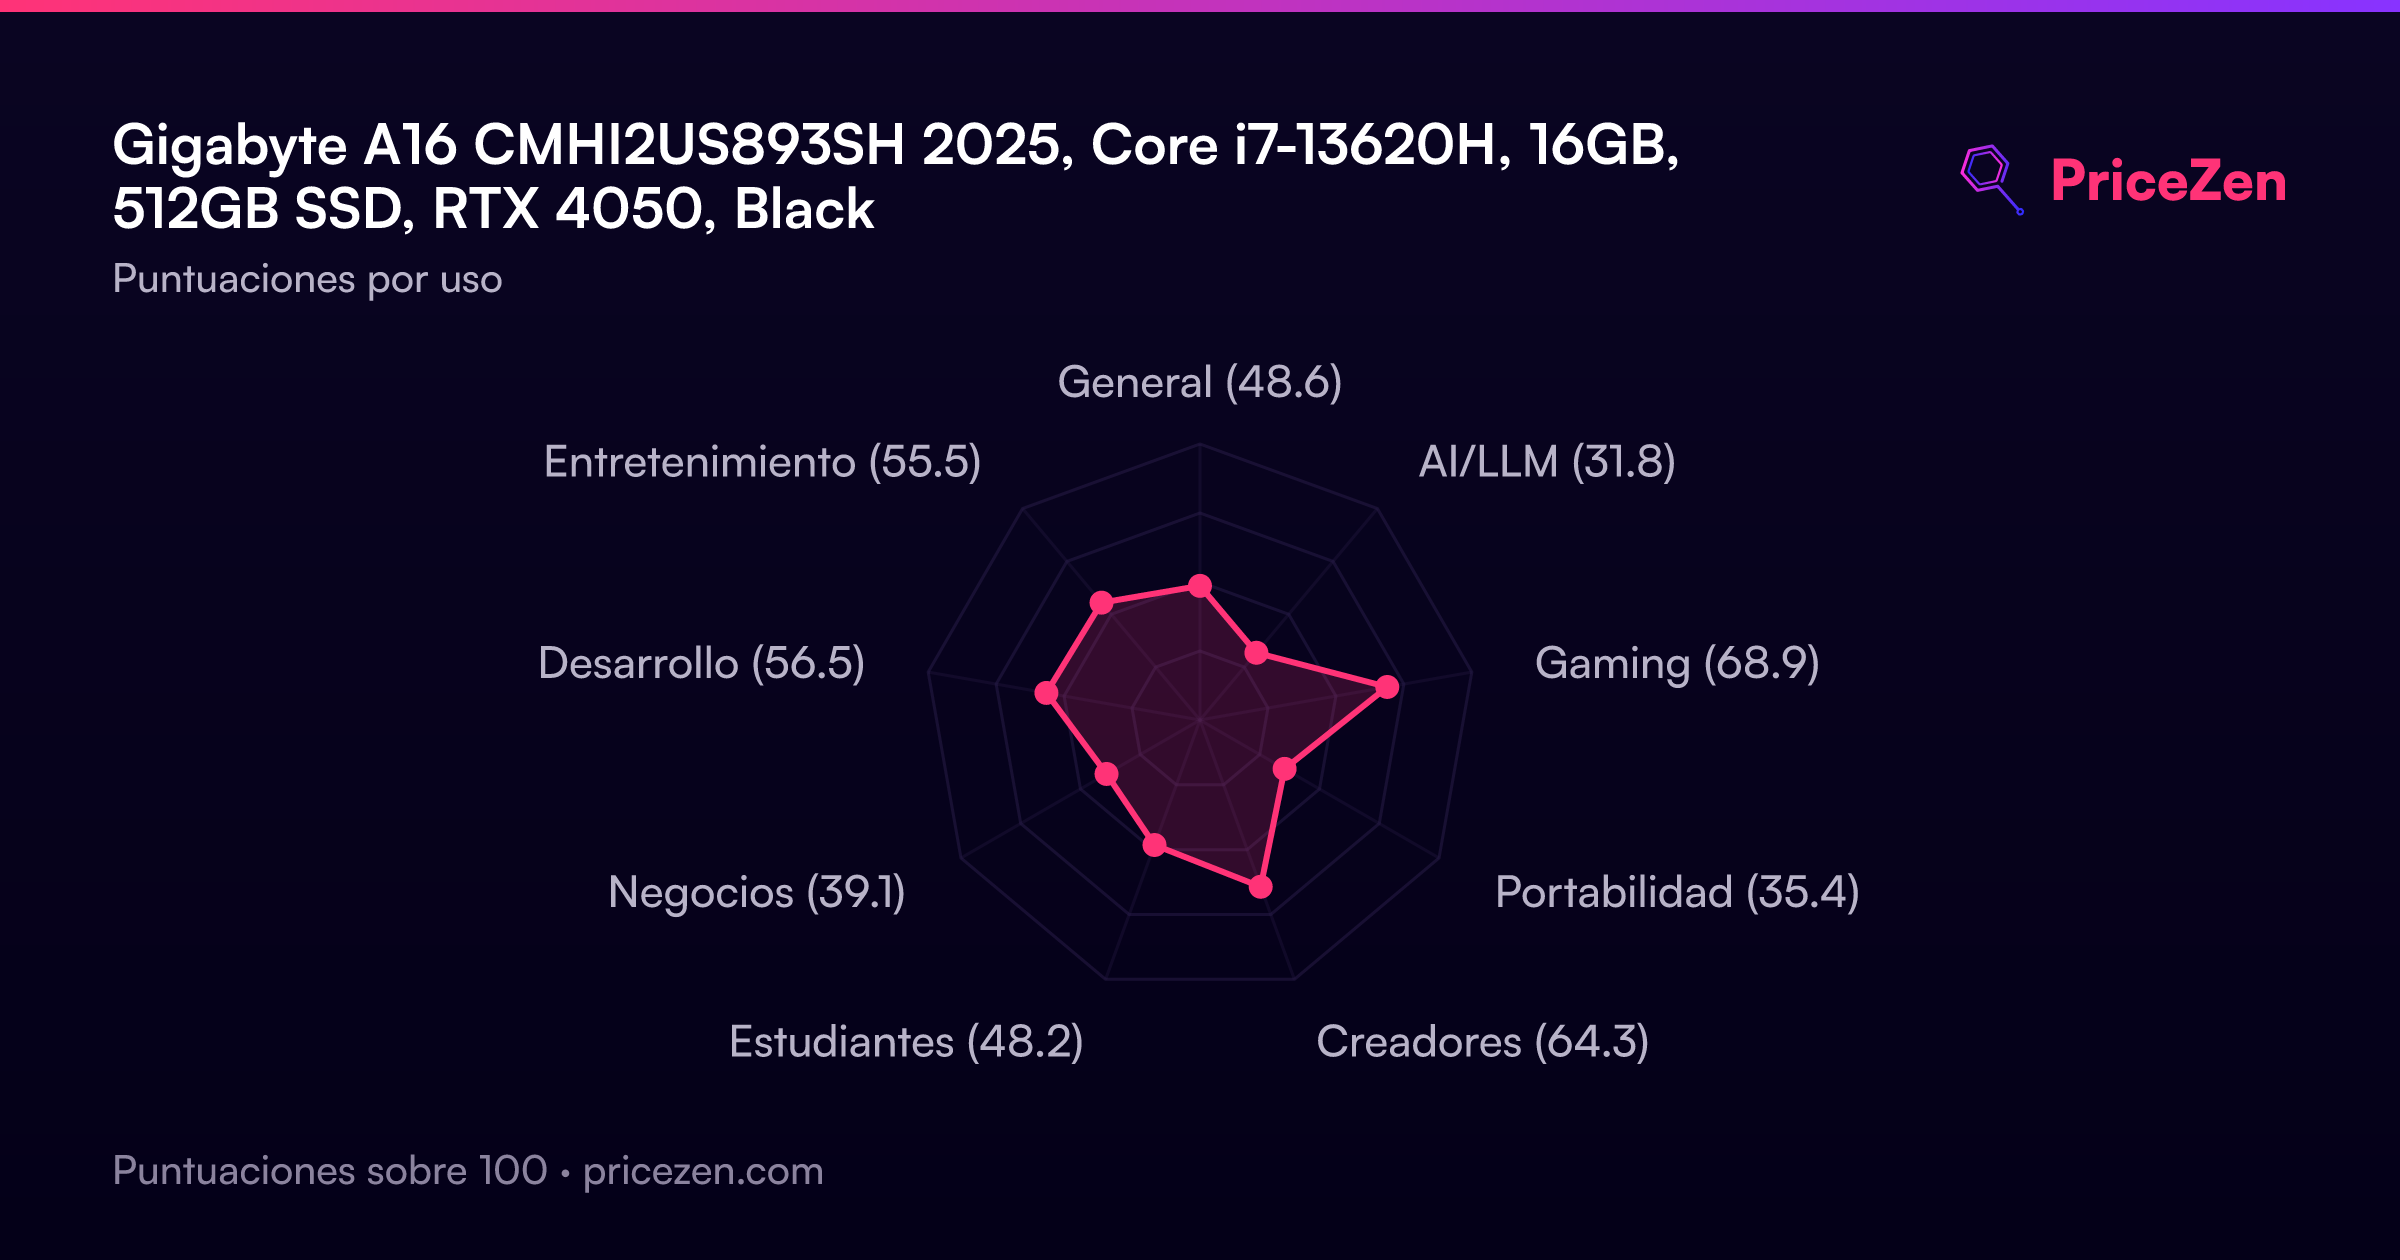
Puntuaciones por uso
- General48.6
- AI/LLM31.8
- Gaming68.9
- Portabilidad35.4
- Creadores64.3
- Estudiantes48.2
- Negocios39.1
- Desarrollo56.5
- Entretenimiento55.5
Pronto habrá un análisis completo. Las especificaciones, puntuaciones, precios y gráficos de arriba siempre están actualizados.
Otras configuraciones17
GAMING A16Intel Core i7 13620H16GB512GBBlack Steel1000 US$GAMING A16 5THP3US893SHAMD Ryzen 7 17016GB512GBBlack Steel1025 US$A16 CMHI2US893SHIntel Core i7 13620H16GB1TBBlack1169 US$Gaming A16 CTHI3US894SHIntel Core i7 13620H16GB512GBBlack Steel1189 US$GAMING A16 5VHP3US893SHAMD Ryzen 7 17016GB512GBBlack Steel1200 US$GAMING A16 CVHI3US894SHIntel Core i7 13620H16GB1TBBlack Steel1227 US$GAMING A16 3VHK3US894SHAMD Ryzen 7 26016GB1TBBlack Steel1250 US$GAMING A16 CVHI3US864SHIntel Core i7 13620H32GB1TBBlack Steel1300 US$A16 CMHI2US893SHIntel Core i7 13620H32GB1TBBlack1349 US$
Ver las 17 configuraciones
A16Intel Core i7 13620H32GB1TBBlack1349 US$Gaming A16 3VHK3US894SHAMD Ryzen 7 26016GB1TBBlack1448 US$GAMING A16 CWHI3US894SHIntel Core i7 13620H16GB1TBBlack Steel1449 US$A16Intel Core i7 13620H16GB1TBBlack Steel1479 US$GAMING A16 3WHK3US894SHAMD Ryzen 7 26016GB1TBBlack Steel1500 US$GAMING A16 CWHI3US864SHIntel Core i7 13620H32GB1TBBlack Steel1520 US$A16Intel Core i7 13620H32GB2TBBlack Steel2029 US$A16Intel Core i7 13620H16GB512GBBlack