CyberPowerPC Gamer Master 2022, Ryzen 5 5500, 16GB, 1TB SSD, RTX 3050, Black
CPU AMD Ryzen 5 5500
RAM 16 GB
Storage 1 TB
GPU NVIDIA GeForce RTX 3050
Form Factor mid-tower
psu w 600
OS Windows 11 Home

53 Puntuación global
Sin precio actual de tiendas
Resumen
Ventajas y desventajas
Ventajas
- Strong gpu (70th percentile) 70th
- Strong storage (69th percentile) 69th
- Strong port selection (67th percentile) 67th
Desventajas
- Below average reliability (27th percentile)
- Below average ram (31st percentile)
Las pruebas
Rendimiento
Especificaciones
Especificaciones completas
Processor
| CPU | AMD Ryzen 5 5500 |
| Cores | 6 |
| Frequency | 3.6 GHz |
| L3 Cache | 16 MB |
Graphics
| GPU | NVIDIA GeForce RTX 3050 |
| Type | Discrete |
| VRAM | 6 GB |
| VRAM Type | GDDR6 |
Memory & Storage
| RAM | 16 GB |
| RAM Generation | DDR4 |
| Storage | 1 TB |
| Storage Type | NVMe SSD |
Build
| Form Factor | mid-tower |
| PSU | 600 |
| Weight | 6.8 kg / 15.0 lbs |
Connectivity
| USB Ports | 8 |
| HDMI | 1x HDMI |
| DisplayPort | 1x DisplayPort |
| Wi-Fi | Wi-Fi 5 |
| Bluetooth | Bluetooth 5.3 |
| Ethernet | Gigabit Ethernet |
System
| OS | Windows 11 Home |
Frente a la competencia
| Spec | CyberPowerPC Gamer Master | Apple Mac Studio M5 Max | Lenovo T Series Towers Legion Tower 5a Gen 10 | Dell Desktop ECT1250 | HP OMEN GT16-0364 | ASUS ROG GM700 |
|---|---|---|---|---|---|---|
| CPU | AMD Ryzen 5 5500 | Apple M5 Max | AMD Ryzen 7 7800X3D | Intel Core Ultra 7 265 | AMD Ryzen 7 8700F | AMD Ryzen 7 9800X3D |
| RAM (GB) | 16 | 36 | 32 | 32 | 32 | 32 |
| Storage (GB) | 1024 | 1024 | 4096 | 2048 | 1024 | 2048 |
| GPU | NVIDIA GeForce RTX 3050 | Apple (32-Core) | NVIDIA GeForce RTX 5070 Ti | Intel UHD Graphics | NVIDIA GeForce RTX 5070 | NVIDIA GeForce RTX 5070 Ti |
| Form Factor | mid-tower | mini | mid-tower | sff | mid-tower | mid-tower |
| Psu W | 600 | 480 | 850 | 180 | 850 | 850 |
| OS | Windows 11 Home | macOS | Windows 11 Home | Windows 11 Home | Windows 11 Home | Windows 11 Home |
| Compare | Compare | Compare | Compare | Compare |
| Producto | CPU | GPU | RAM | Puertos | Almacenamiento | Fiabilidad |
|---|---|---|---|---|---|---|
| CyberPowerPC Gamer Master | 49.5 | 70.4 | 31.4 | 67.3 | 68.9 | 27 |
| Apple Mac Studio M5 Max Compare | 95.7 | 85.2 | 92.4 | 88.9 | 68.9 | 99.3 |
| Lenovo T Series Towers Legion Tower 5a Gen 10 Compare | 73.4 | 94.7 | 78 | 88.3 | 98.1 | 69.9 |
| Dell Desktop ECT1250 Compare | 88.2 | 60.3 | 81.7 | 74.5 | 82.7 | 69.9 |
| HP OMEN GT16-0364 Compare | 69.6 | 90.8 | 87.1 | 97.8 | 53.6 | 69.9 |
| ASUS ROG GM700 Compare | 80.6 | 94.7 | 81.7 | 96 | 90.1 | 37.1 |
Precio
Relación calidad-precio
Historial de precios
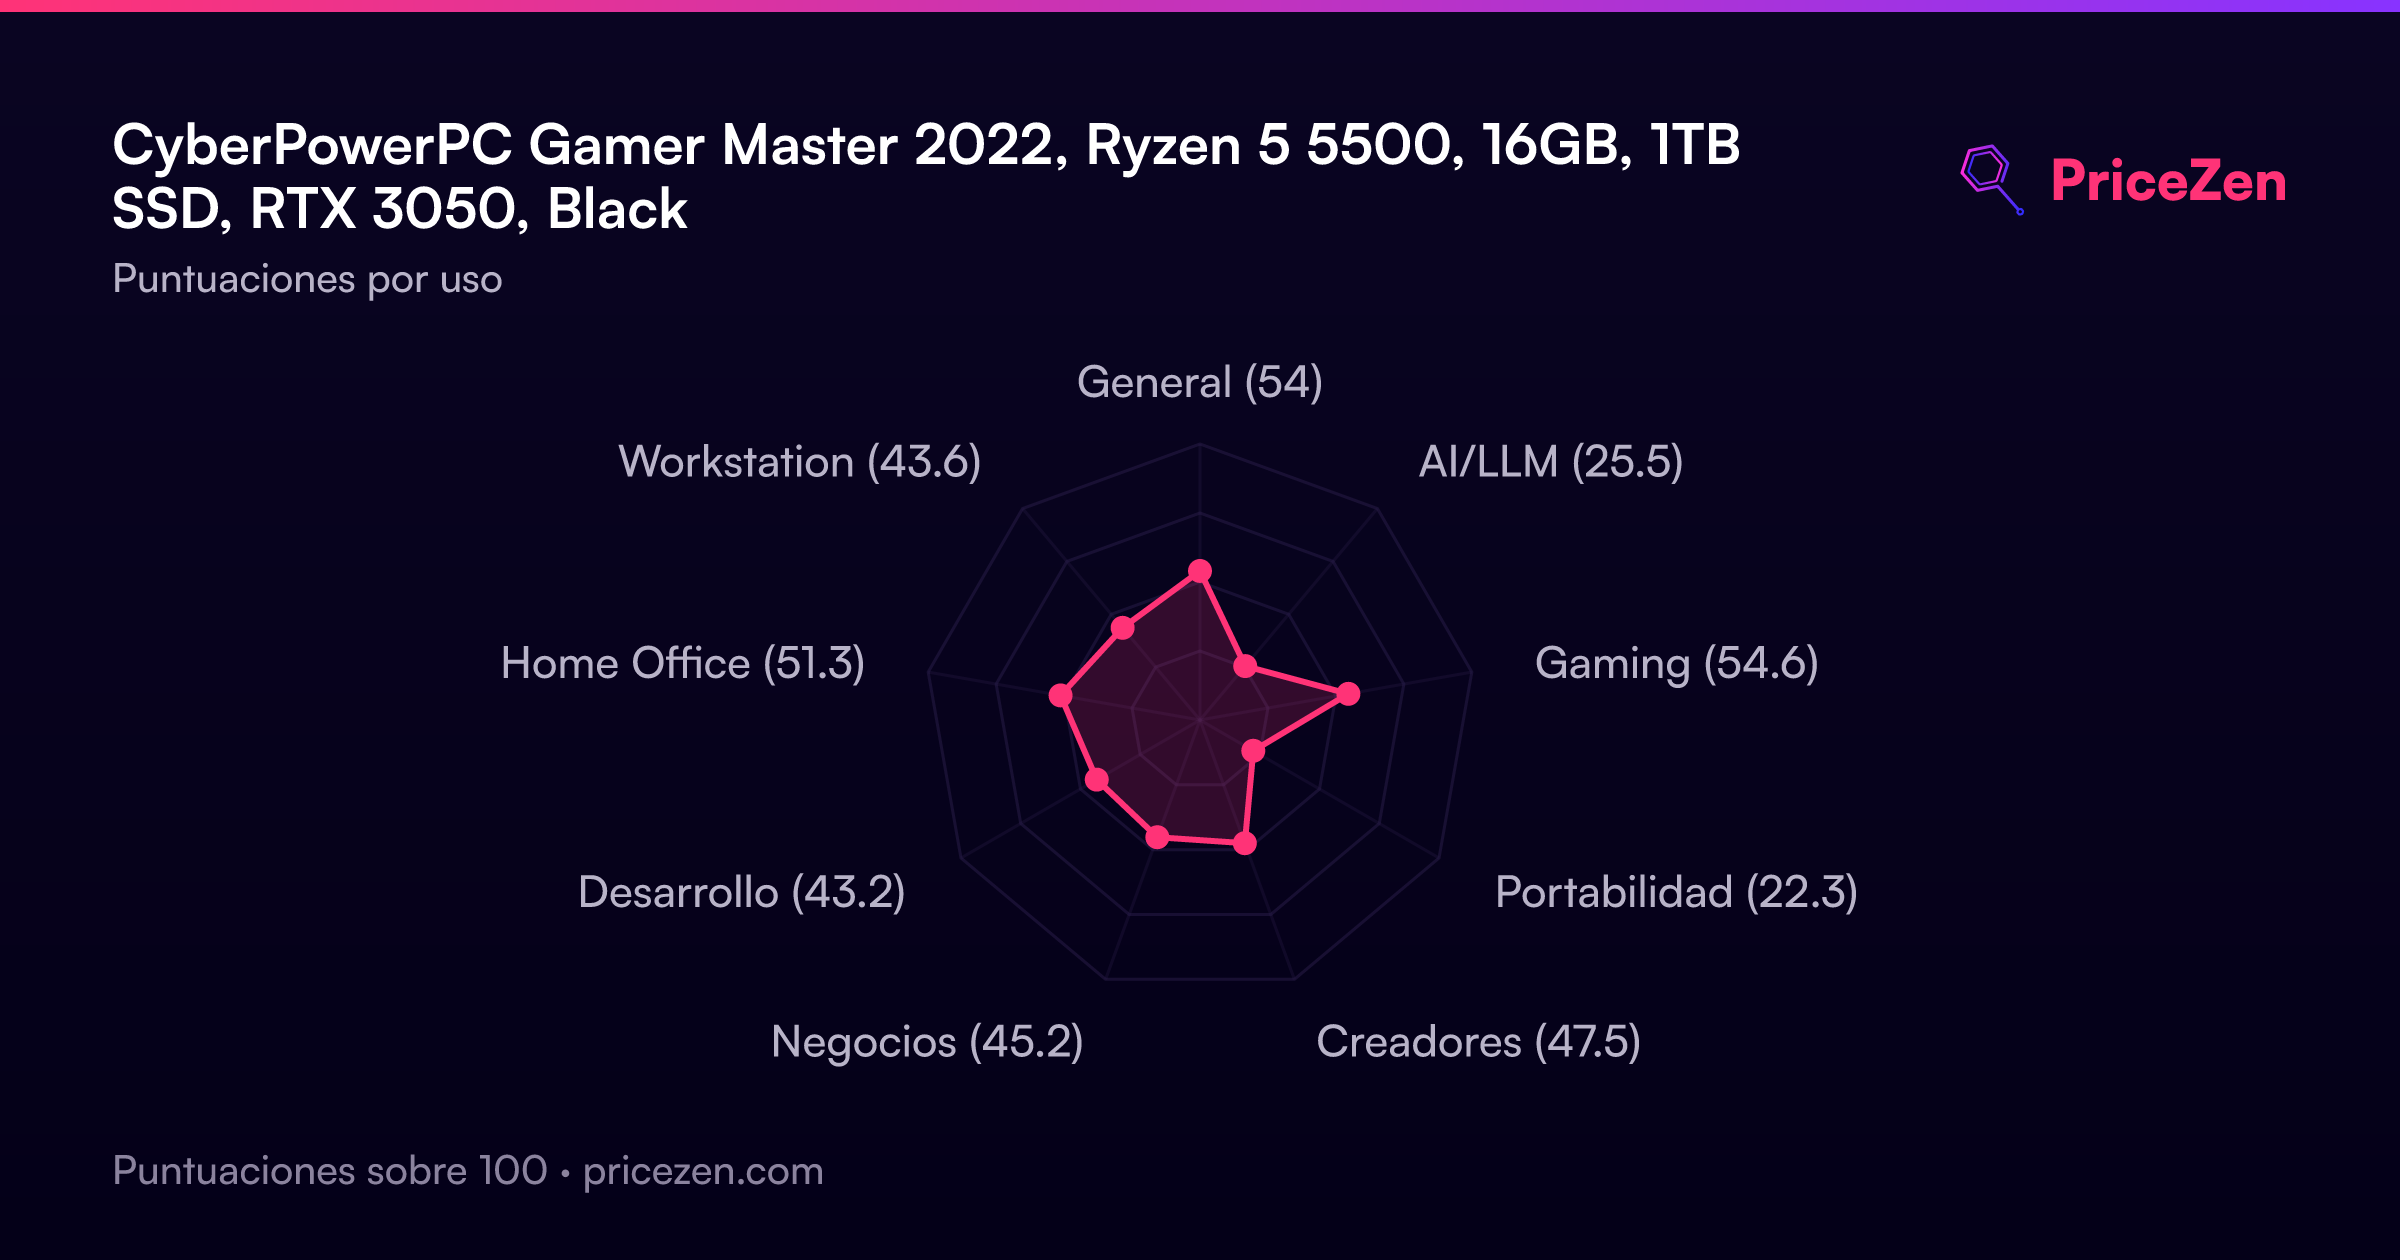
Puntuaciones por uso
- General53.1
- AI/LLM25.9
- Gaming54.2
- Portabilidad21.9
- Creadores47.7
- Negocios44.3
- Desarrollo42.8
- Home Office50.1
- Workstation44.1
Pronto habrá un análisis completo. Las especificaciones, puntuaciones, precios y gráficos de arriba siempre están actualizados.