Nuevo
HP ProDesk 400 G5 SFF, Core i3-8100, 32GB, 512GB SSD, Black/Silver
CPU Intel Core i3 8100
RAM 32 GB
Storage 512 GB
GPU Intel UHD Graphics 630
Form Factor sff
psu w 180
OS Windows 11 Pro

41 Puntuación global
Precio 680 US$
Resumen
Ventajas y desventajas
Ventajas
- Strong reliability (70th percentile) 70th
Desventajas
- Below average cpu (17th percentile)
- Below average port selection (18th percentile)
- Below average storage (29th percentile)
Las pruebas
Rendimiento
Especificaciones
Especificaciones completas
Processor
| CPU | Intel Core i3 8100 |
| Cores | 4 |
| Frequency | 3.6 GHz |
| L3 Cache | 6 MB |
Graphics
| GPU | Intel UHD Graphics 630 |
| Type | Integrated |
| VRAM Type | Shared |
Memory & Storage
| RAM | 32 GB |
| RAM Generation | DDR4 |
| Storage | 512 GB |
| Storage Type | SSD |
Build
| Form Factor | sff |
| PSU | 180 |
Connectivity
| DisplayPort | 1 Display Port |
| Ethernet | Integrated |
System
| OS | Windows 11 Pro |
Frente a la competencia
| Spec | HP ProDesk 400 G5 SFF | Apple Mac Studio M3 Ultra | Lenovo Legion 90YA003GUS | Dell Desktop ECT1250 | MSI Aegis Z2 C7NVP-1449US | iBUYPOWER Element EBI7N5701 |
|---|---|---|---|---|---|---|
| CPU | Intel Core i3 8100 | Apple M3 Ultra | Intel Core Ultra 7 265F | Intel Core Ultra 7 265 | AMD Ryzen 7 7700 | Intel Core Ultra 7 265F |
| RAM (GB) | 32 | 96 | 32 | 32 | 32 | 32 |
| Storage (GB) | 512 | 1024 | 1024 | 2048 | 1024 | 2048 |
| GPU | Intel UHD Graphics 630 | Apple M3 Ultra 60-core | NVIDIA GeForce RTX 5060 Ti | Intel UHD Graphics | NVIDIA GeForce RTX 5070 | NVIDIA GeForce RTX 5070 |
| Form Factor | sff | sff | mid-tower | sff | mid-tower | mid-tower |
| Psu W | 180 | - | 500 | 180 | 750 | 750 |
| OS | Windows 11 Pro | macOS | Windows 11 Home | Windows 11 Home | Windows 11 Home | Windows 11 Home |
| Compare | Compare | Compare | Compare | Compare |
| Producto | CPU | GPU | RAM | Puertos | Almacenamiento | Fiabilidad |
|---|---|---|---|---|---|---|
| HP ProDesk 400 G5 SFF | 17 | 36.6 | 58.7 | 18.4 | 29.2 | 70.1 |
| Apple Mac Studio M3 Ultra Compare | 99.7 | 77.4 | 95.7 | 93.6 | 53.4 | 99.3 |
| Lenovo Legion 90YA003GUS Compare | 90.5 | 83.3 | 81.6 | 93 | 68.7 | 70.1 |
| Dell Desktop ECT1250 Compare | 88.1 | 60.2 | 81.6 | 75 | 82.6 | 70.1 |
| MSI Aegis Z2 C7NVP-1449US Compare | 74.6 | 90.7 | 87.1 | 93.6 | 68.7 | 37.4 |
| iBUYPOWER Element EBI7N5701 Compare | 90.5 | 90.7 | 78 | 97.9 | 90 | 27.2 |
Precio
Relación calidad-precio
Desde 680 US$
Newegg 1 oferta Desde 680 US$
Seguimos los precios de este producto desde el 22 nov 2026. El gráfico aparecerá cuando tengamos más datos.
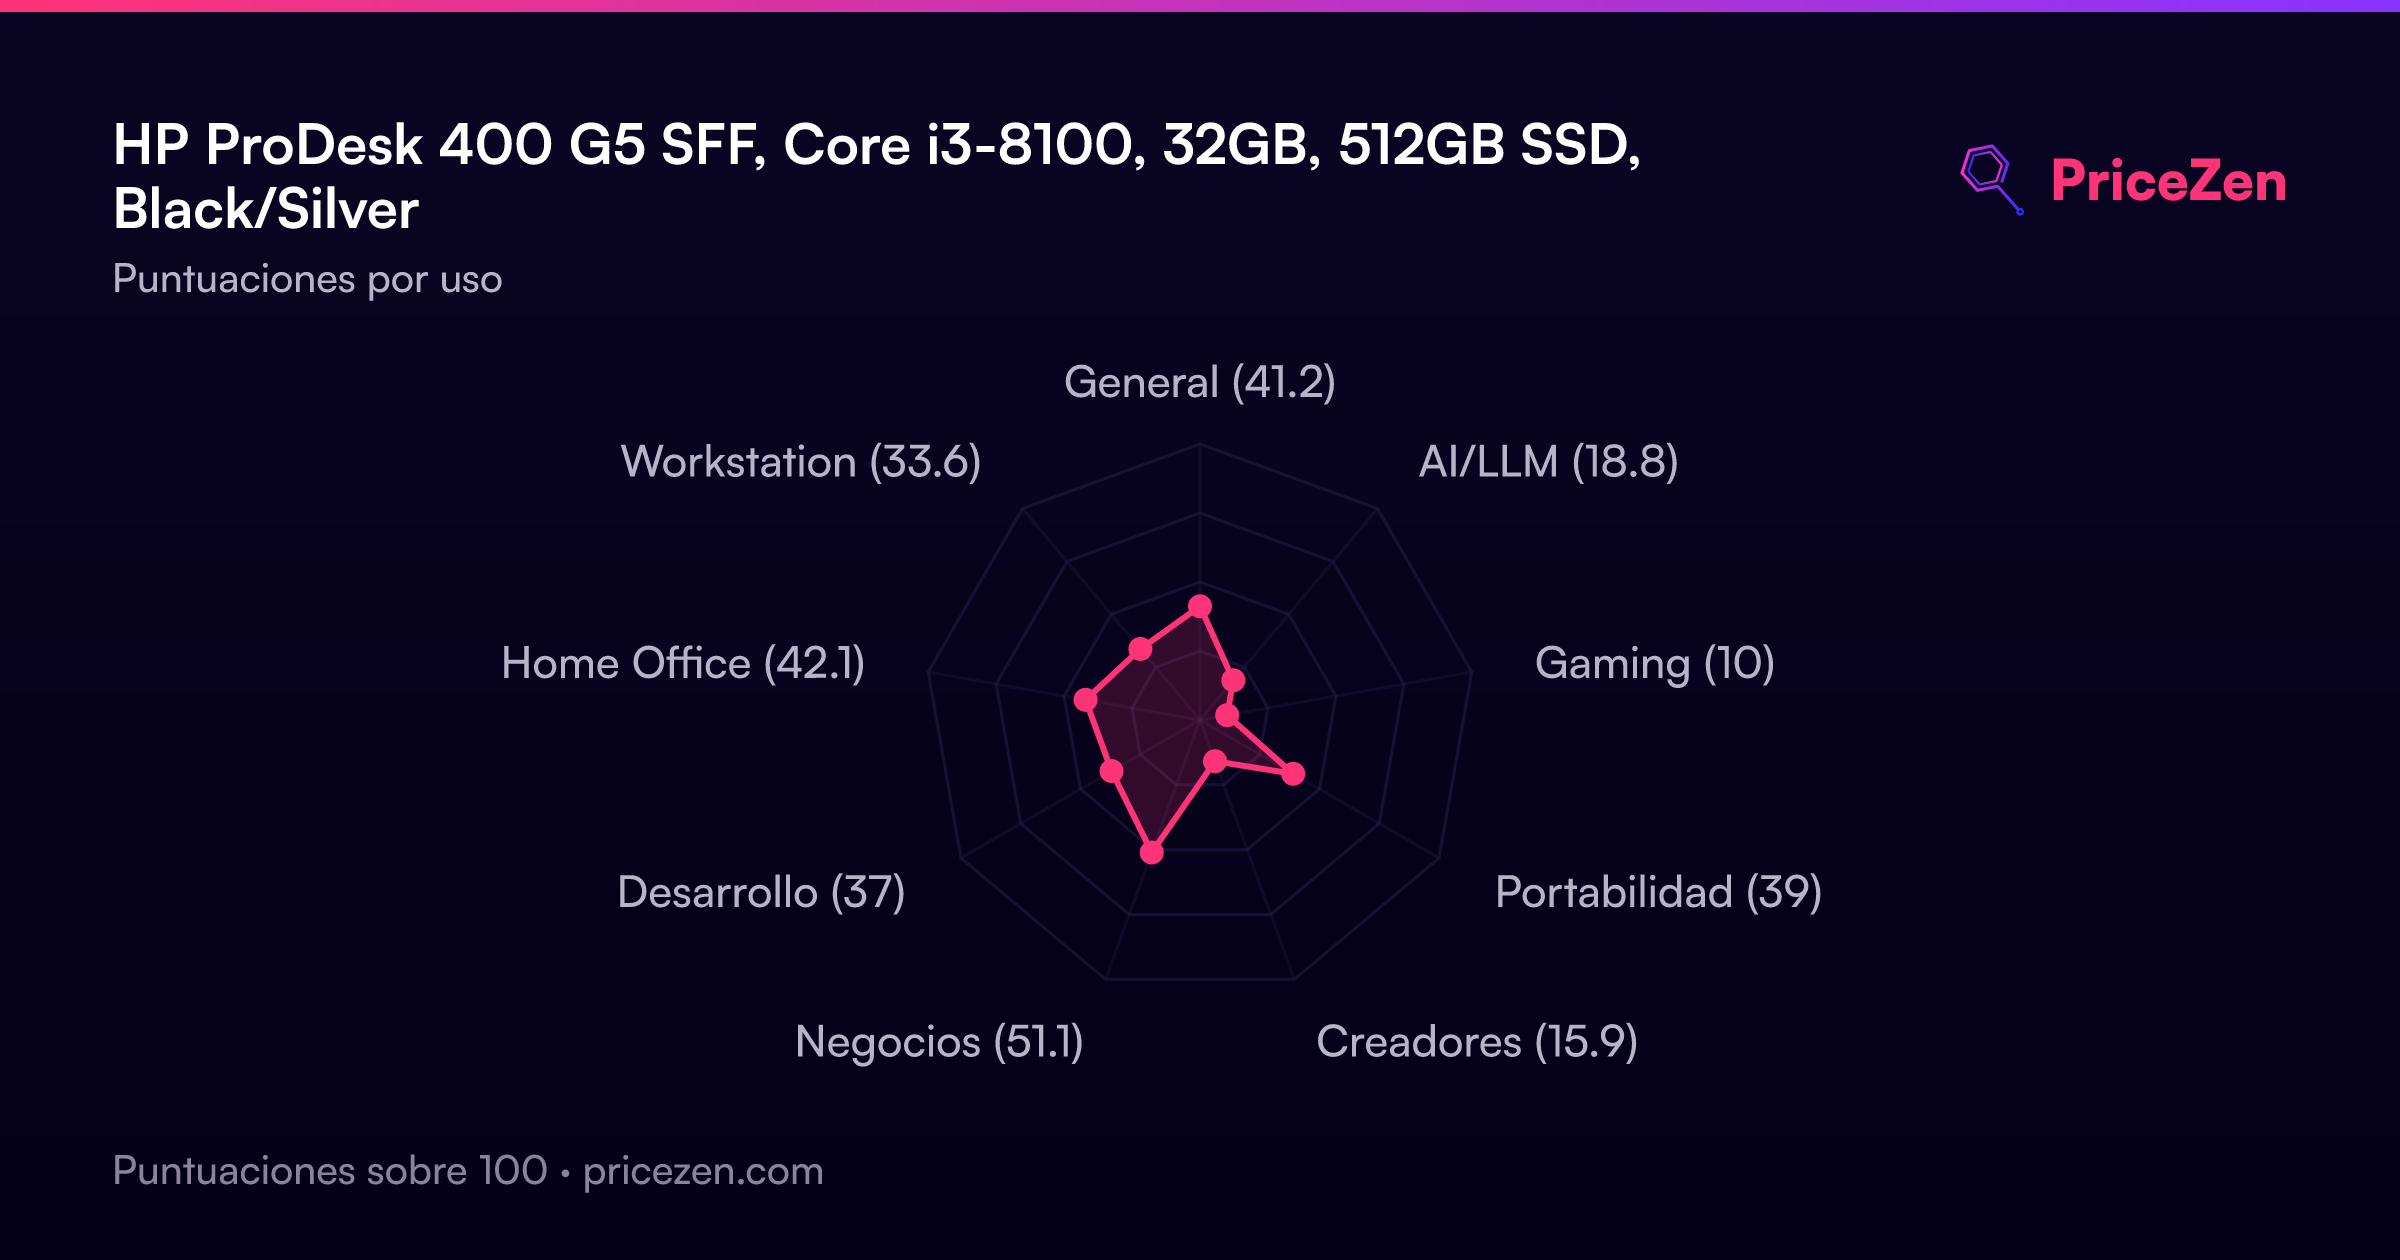
Puntuaciones por uso
- General41.2
- AI/LLM18.8
- Gaming10
- Portabilidad39
- Creadores15.9
- Negocios51.1
- Desarrollo37
- Home Office42.1
- Workstation33.6
Pronto habrá un análisis completo. Las especificaciones, puntuaciones, precios y gráficos de arriba siempre están actualizados.
Otras configuraciones33
ProDesk 400 G5 SFFIntel Core i5-850016GB512GBBlack248 US$ProDesk 400 G5Intel Core i5 840016GB256GBBlack260 US$ProDesk 400 G5 SFFIntel Core i5 84008GB256GBBlack270 US$ProDesk 400 G5 SFFIntel Core i5 85008GB256GBBlack270 US$ProDesk 400 G5Intel Core i5 840016GB512GBBlack290 US$ProDesk 400 G5 SFFIntel Core i5 840016GB256GBBlack305 US$ProDesk 400 G5 SFFIntel Core i5 950016GB512GBBlack310 US$ProDesk 400 G5 SFFIntel Core i5 950016GB1TBBlack355 US$ProDesk 400 G5Intel 8th Generation Core i516GB1280GBBlack420 US$
Ver las 33 configuraciones
ProDesk 400 G5 SFFIntel Core i3-81008GB256GBBlack/Silver147 US$ProDesk 400 G5 SFFIntel Core i3 8th Gen8GB512GBBlack/Silver185 US$ProDesk 400 G5 SFFIntel Core i3 8th Gen32GB512GBBlack/Silver193 US$ProDesk 400 G5 SFFIntel Core i5 850016GB256GB202 US$ProDesk 400 G5Intel Core i5 84008GB256GBBlack205 US$ProDesk 400 G5 SFFIntel Core i5 950016GB256GBBlack219 US$ProDesk 400 G5 SFFIntel Core i5 95008GB256GBBlack230 US$ProDesk 400 G5 SFFIntel Core i3-810016GB256GBBlack/SilverProDesk 400 G5 SFFIntel Core i3 810016GB512GBBlack/SilverProDesk 400 G5Intel Core i5 85008GB256GBBlack/SilverProDesk 400 G5 SFFIntel Core i3 8th Gen16GB512GBBlack/SilverProDesk 400 G5Intel Core I5-850016GB512GBBlack/SilverProDesk 400 G5 SFFIntel Core i3 81008GB512GBBlack/SilverProDesk 400 G5 SFFIntel Core i38GB1TBBlack/SilverProDesk 400 G5 SFFIntel Core i316GB1TBBlack/SilverProDesk 400 G5 SFFIntel Core i332GB1TBBlack/SilverProDesk 400 G5Intel Core i5 850032GB1TBBlack/SilverProDesk 400 G5Intel Core I5-850032GB2TBBlack/SilverProDesk 400 G5Intel Core i5 850032GB512GBBlack/SilverProDesk 400 G5Intel Core i5 85008GB512GBBlack/SilverProDesk 400 G5Intel Core i5 850016GB2TBBlack/SilverProDesk 400 G5Intel Core i5 8th Gen16GB256GBBlack/SilverProDesk 400 G5Intel Core i5 850016GB1TBBlack/SilverProDesk 400 G5Intel Core i3 810016GB512GBBlack