Dell OptiPlex 5070 2019, Core i7-9700, 32GB, 512GB SSD + 1TB HDD, Black/Silver
CPU Intel Core i7-9700
RAM 32 GB
Storage 1536 GB
GPU Intel UHD Graphics 630
Form Factor sff
psu w 200
OS Windows 10 Pro

60 Puntuación global
Sin precio actual de tiendas
Resumen
Ventajas y desventajas
Ventajas
- Strong port selection (84th percentile) 84th
- Strong storage (79th percentile) 79th
- Strong reliability (70th percentile) 70th
Desventajas
Las pruebas
Rendimiento
Especificaciones
Especificaciones completas
Processor
| CPU | Intel Core i7-9700 |
| Cores | 8 |
| Frequency | 3.0 GHz |
| L3 Cache | 12 MB |
Graphics
| GPU | Intel UHD Graphics 630 |
| Type | Integrated |
| VRAM Type | Shared |
Memory & Storage
| RAM | 32 GB |
| RAM Generation | DDR4 |
| Storage 1 | 512 GB |
| Storage 1 Type | NVMe SSD |
| Storage 2 | 1 TB |
| Storage 2 Type | HDD |
Build
| Form Factor | sff |
| PSU | 200 |
| Weight | 5.2 kg / 11.6 lbs |
Connectivity
| USB-C Ports | 1 |
| USB Ports | 9 |
| DisplayPort | 2x DisplayPort |
| Wi-Fi | Wi-Fi 5 (802.11ac) |
| Bluetooth | Bluetooth 4.0 |
| Ethernet | Gigabit Ethernet |
System
| OS | Windows 10 Pro |
Frente a la competencia
| Spec | Dell OptiPlex 5070 | Apple Mac Studio M3 Ultra | HP OmniDesk M02-0234 | MSI Aegis Z2 A8NVL-1610US | iBUYPOWER Slate MESH SMI7N4601 | Lenovo Yoga AIO F0J20012US |
|---|---|---|---|---|---|---|
| CPU | Intel Core i7-9700 | Apple M3 Ultra | AMD Ryzen 7 8700G | AMD Ryzen 7 8700F | Intel Core i7 14700F | Intel Core Ultra 7 255H |
| RAM (GB) | 32 | 96 | 16 | 16 | 32 | 16 |
| Storage (GB) | 1536 | 1024 | 1536 | 3072 | 1024 | 2048 |
| GPU | Intel UHD Graphics 630 | Apple M3 Ultra 60-core | AMD Radeon 780M | NVIDIA GeForce RTX 5060 | NVIDIA GeForce RTX 4060 | Intel Arc Graphics |
| Form Factor | sff | sff | mini-tower | mid-tower | mid-tower | aio |
| Psu W | 200 | - | 280 | 650 | 600 | 170 |
| OS | Windows 10 Pro | macOS | Windows 11 Home | Windows 11 Home | Windows 11 Home | Windows 11 Home |
| Compare | Compare | Compare | Compare | Compare |
| Producto | CPU | GPU | RAM | Puertos | Almacenamiento | Fiabilidad |
|---|---|---|---|---|---|---|
| Dell OptiPlex 5070 | 40 | 36.6 | 58.6 | 84.1 | 79.1 | 70 |
| Apple Mac Studio M3 Ultra Compare | 99.7 | 77.5 | 95.7 | 93.6 | 53.4 | 99.3 |
| HP OmniDesk M02-0234 Compare | 71.8 | 64.8 | 51.2 | 94.5 | 79.6 | 70 |
| MSI Aegis Z2 A8NVL-1610US Compare | 69.5 | 79.7 | 56.5 | 90.3 | 96.4 | 37.3 |
| iBUYPOWER Slate MESH SMI7N4601 Compare | 84.4 | 75.4 | 77.9 | 95.5 | 68.8 | 27.1 |
| Lenovo Yoga AIO F0J20012US Compare | 70.3 | 60.2 | 57.5 | 60.5 | 82.7 | 70 |
Precio
Relación calidad-precio
Seguimos los precios de este producto desde el 7 jul 2026. El gráfico aparecerá cuando tengamos más datos.
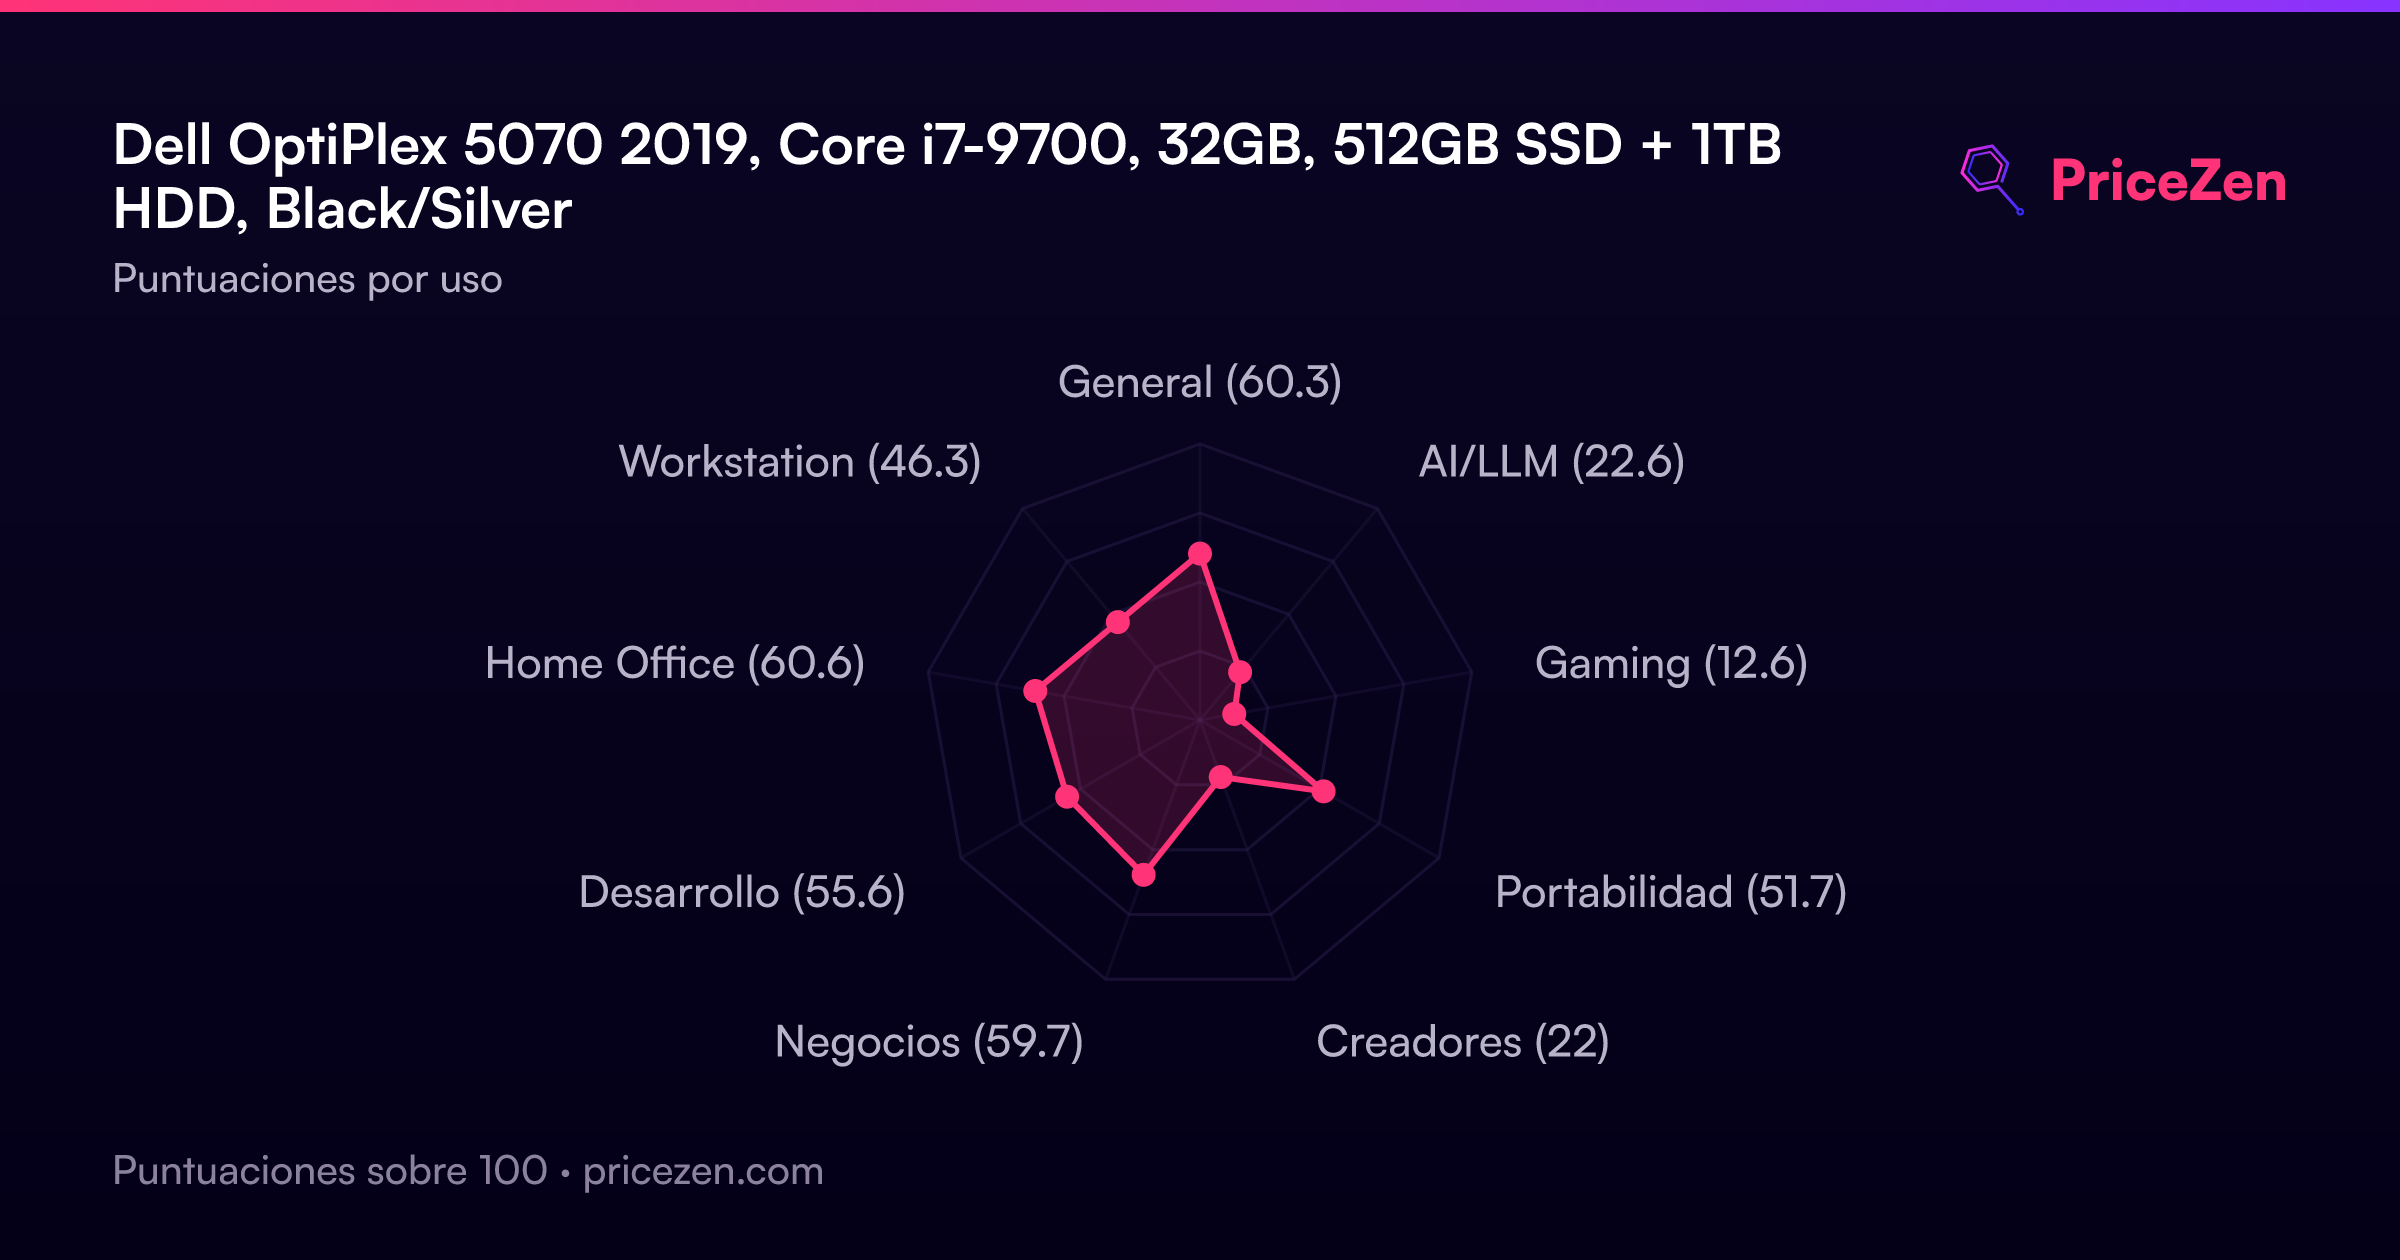
Puntuaciones por uso
- General60.3
- AI/LLM22.6
- Gaming12.6
- Portabilidad51.7
- Creadores22
- Negocios59.7
- Desarrollo55.6
- Home Office60.6
- Workstation46.3
Pronto habrá un análisis completo. Las especificaciones, puntuaciones, precios y gráficos de arriba siempre están actualizados.
Otras configuraciones36
OptiPlex 5070 SFFi5-950016GB256GB259 US$OptiPlex 5070 SFFIntel Core i7 97008GB256GB279 US$OptiPlex 5070Intel Core i5 9th Gen16GB1524GBBlack286 US$OptiPlex 5070Intel Core i5 950016GB256GBBlack289 US$OptiPlex 5070Intel Core i5 950016GB512GBBlack290 US$OptiPlex 5070Intel Core i5 95008GB512GBBlack320 US$OptiPlex 5070 SFFIntel Core i5 950016GB1TB339 US$OptiPlex 5070Intel Core i5 950032GB256GBBlack362 US$OptiPlex 5070-SFFIntel Core i7 970016GB500GBBlack363 US$
Ver las 36 configuraciones
OptiPlex 5070Intel Core i5 950032GB512GBBlack374 US$OptiPlex 5070Intel Core i7 970016GB256GBBlack378 US$OptiPlex 5070-SFFIntel Core i7 970016GB256GBBlack381 US$OptiPlex 5070Intel Core i7 970016GB512GBBlack388 US$OptiPlex 5070Intel Core i5 950032GB1TBBlack390 US$OptiPlex 5070Intel Core i7 970032GB256GBBlack400 US$OptiPlex 5070 SFFi5-950032GB512GB400 US$OptiPlex 5070Intel Core i7 970016GB1TBBlack421 US$OptiPlex 5070-SFFIntel Core i7-970032GB500GBBlack434 US$OptiPlex 5070i5-950032GB2TBBlack/Silver439 US$OptiPlex 5070 SFFIntel Core i7 970032GB1TBBlack450 US$OptiPlex 5070Intel Core i7 970032GB1TBBlack453 US$OptiPlex 5070Intel Core i7-970064GB1TBBlack/Silver514 US$OptiPlex 5070Intel Core i7-970064GB3TBBlack/Silver564 US$OptiPlex 5070 SFFIntel Core i7 970016GB1TBOptiPlex 5070Intel Core i5 95008GB256GBBlack/SilverOptiPlex 5070 SFFOptiPlex 5070 SFFIntel Core i7 970032GB256GBOptiPlex 5070 SFFIntel Core i7 970016GB512GB5070 SFFIntel Core i5 950032GB256GBOptiPlex 5070 SFFIntel Core i7 970016GB2TBOptiPlex 5070 SFFIntel Core i7 970032GB2TBOptiPlex 5070 SFFIntel Core i5 950032GB1TBOptiPlex 5070 SFFIntel Core i5 950032GB2TBOptiPlex 5070 SFFIntel Core i5 950016GB2TBOptiPlex 5070 SFFIntel Core i5 950016GB512GBOptiPlex 5070i5-95008GB256GB