Nuevo
Dell OptiPlex 3070 SFF, Core i5-8500, 8GB, 128GB SSD
CPU Intel Core i5 8500
RAM 8 GB
Storage 128 GB
GPU Intel UHD Graphics 630
Form Factor sff
OS Windows 11 Pro

35 Puntuación global
Precio 264 US$
Resumen
Ventajas y desventajas
Ventajas
- Strong reliability (70th percentile) 70th
Desventajas
- Below average storage (6th percentile)
- Below average ram (9th percentile)
- Below average cpu (29th percentile)
- Below average port selection (33rd percentile)
Las pruebas
Rendimiento
Especificaciones
Especificaciones completas
Processor
| CPU | Intel Core i5 8500 |
| Cores | 6 |
| Frequency | 3.0 GHz |
Graphics
| GPU | Intel UHD Graphics 630 |
| Type | Integrated |
| VRAM Type | Shared |
Memory & Storage
| RAM | 8 GB |
| RAM Generation | DDR4 |
| Storage | 128 GB |
| Storage Type | SSD |
Build
| Form Factor | sff |
Connectivity
| USB Ports | 4 |
| HDMI | ✓ |
| DisplayPort | Display Port |
| Ethernet | Ethernet Port (RJ-45) |
System
| OS | Windows 11 Pro |
Frente a la competencia
| Spec | Dell OptiPlex 3070 SFF | HP OmniDesk M02-000 | Minisforum DeskMini UM880 Plus | ASUS NUC 14 Pro NUC14RVHv5 | Lenovo ThinkCentre 50q Gen 4 | BOSGAME P3 |
|---|---|---|---|---|---|---|
| CPU | Intel Core i5 8500 | AMD Ryzen 7 8700G | AMD Ryzen 7 255 | Intel Core Ultra 5 135H | Intel Core i5 13420H | AMD Ryzen 7 6800H |
| RAM (GB) | 8 | 16 | 32 | 32 | 32 | 32 |
| Storage (GB) | 128 | 2048 | 1024 | 2048 | 1024 | 1024 |
| GPU | Intel UHD Graphics 630 | AMD Radeon 740M Graphics | AMD Radeon 780M | Intel Arc Graphics | Intel UHD Graphics | AMD Radeon 680M |
| Form Factor | sff | mid-tower | mini | mini | mini | mini |
| Psu W | - | - | 120 | 120 | - | 65 |
| OS | Windows 11 Pro | Windows 11 Home | Windows | Windows 11 Home | Windows 11 Pro | Windows 11 Pro |
| Compare | Compare | Compare | Compare | Compare |
| Producto | CPU | GPU | RAM | Puertos | Almacenamiento | Fiabilidad |
|---|---|---|---|---|---|---|
| Dell OptiPlex 3070 SFF | 29.4 | 36.6 | 9.1 | 32.8 | 5.7 | 70.1 |
| HP OmniDesk M02-000 Compare | 71.7 | 64.7 | 51.2 | 96.7 | 82.6 | 70.1 |
| Minisforum DeskMini UM880 Plus Compare | 64.9 | 64.7 | 81.6 | 65.5 | 53.4 | 11.6 |
| ASUS NUC 14 Pro NUC14RVHv5 Compare | 53.8 | 60.2 | 81.6 | 98.2 | 82.6 | 37.4 |
| Lenovo ThinkCentre 50q Gen 4 Compare | 45.9 | 50.1 | 63.8 | 87.2 | 68.7 | 70.1 |
| BOSGAME P3 Compare | 54.9 | 45.5 | 76.3 | 65.5 | 68.7 | 11.6 |
Precio
Relación calidad-precio
Desde 264 US$
Newegg 1 oferta Desde 264 US$
Seguimos los precios de este producto desde el 22 nov 2026. El gráfico aparecerá cuando tengamos más datos.
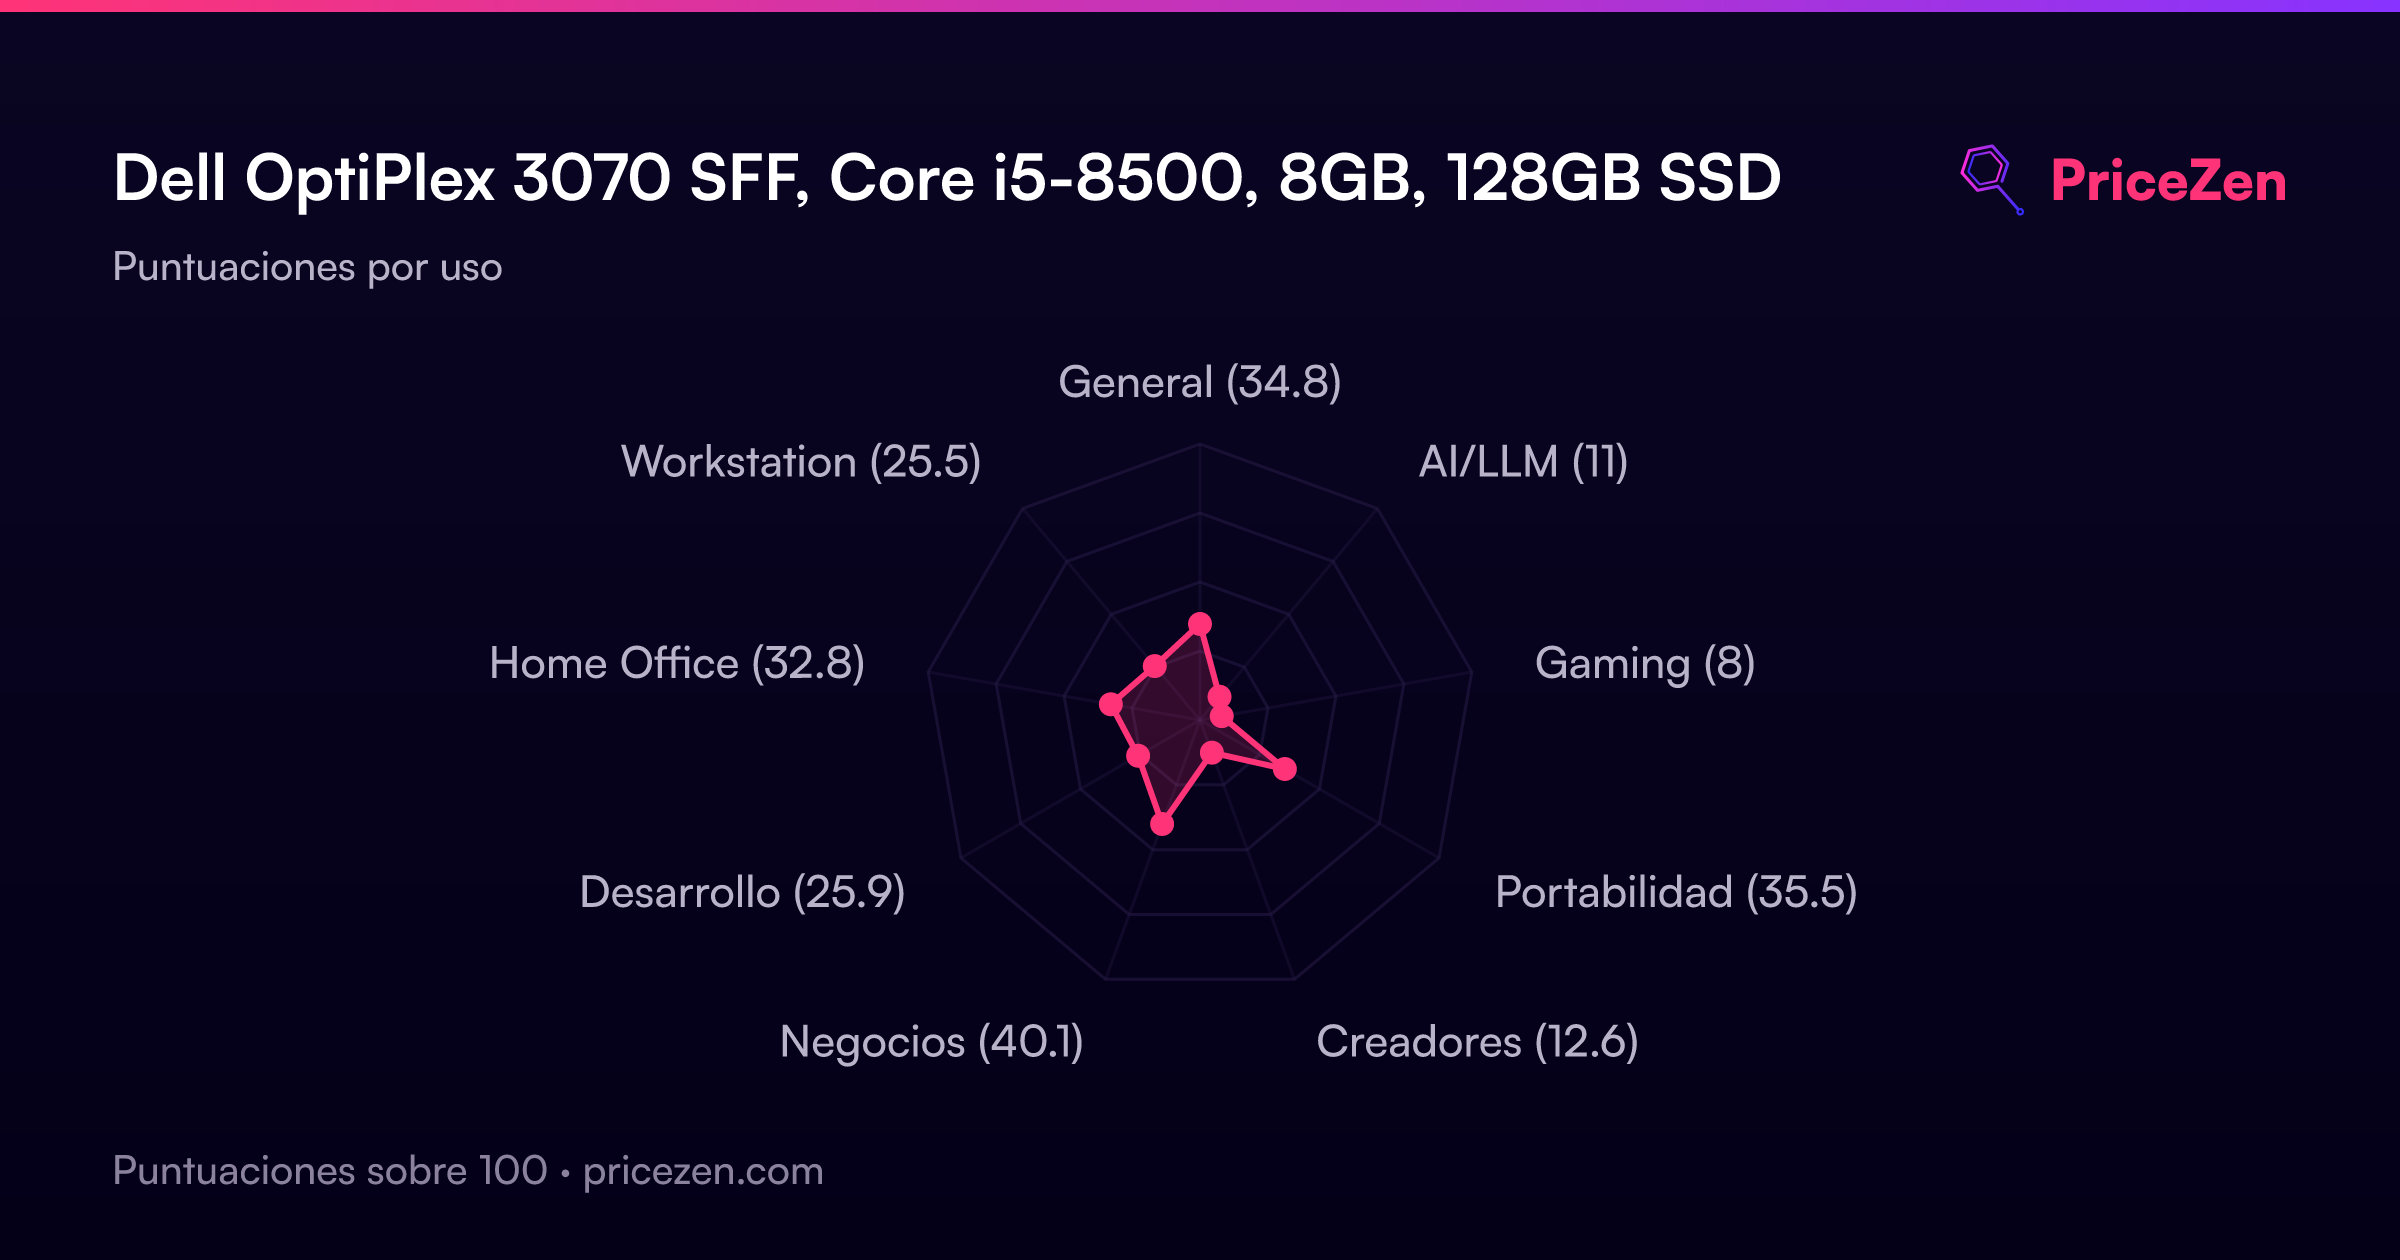
Puntuaciones por uso
- General34.8
- AI/LLM11
- Gaming8
- Portabilidad35.5
- Creadores12.6
- Negocios40.1
- Desarrollo25.9
- Home Office32.8
- Workstation25.5
Pronto habrá un análisis completo. Las especificaciones, puntuaciones, precios y gráficos de arriba siempre están actualizados.
Otras configuraciones26
OptiPlex 3070-SFFIntel Core i5-850016GB256GB199 US$OptiPlex 3070 SFFIntel Core i5 9500T8GB256GB247 US$OptiPlex 3070Intel Core i5 850016GB512GB248 US$OptiPlex 3070Intel Core i5 950016GB256GB250 US$OptiPlex 3070Intel Core i5 850016GB256GB250 US$OptiPlex 3070Intel Core i5 950016GB512GB279 US$OptiPlex 3070Intel Core i5 8th Gen16GB512GB300 US$OptiPlex 3070Intel Core i5-950016GB1524GB309 US$OptiPlex 3070 SFFIntel Core i5 9500T16GB512GB315 US$
Ver las 26 configuraciones
OptiPlex 3070-SFFIntel Core i7-970016GB500GB336 US$Optiplex 3070Intel Core i5 950016GB1TB349 US$OptiPlex 3070Intel Core i5-950032GB1524GB424 US$OptiPlex 3070Intel Core i5 950032GB1TB430 US$OptiPlex 3070 Small Form FactorIntel Core i7 970032GB1TB440 US$OptiPlex 3070-SFFIntel Core i7-870032GB500GB447 US$OptiPlex 3070Intel Core i7-970032GB1TB460 US$OptiPlex 3070-SFFIntel Core i7-970032GB1TB469 US$OptiPlex 3070 SFFIntel Core i5-950032GB1TB532 US$OptiPlex 3070Intel Core i5 950032GB2TB558 US$OptiPlex 3070Intel Core i5 85008GB512GBOptiPlex 3070Intel Core i5 850032GB512GBOptiPlex 3070 SFFIntel Core i5 95008GB256GBOptiPlex 3070Intel Core i5 850032GB2TBOptiPlex 3070Intel Core i5 850016GB2TBOptiPlex 3070 SFFIntel Core i5-9500 6 Core Processor8GB256GBOptiPlex 3070Intel Core i5 950016GB1TB