HP Essential 17.3" TPN-Q311, Core i7-1355U, 16GB, 1TB SSD, Silver
CPU Intel Core i7 1355U
RAM 16 GB
Storage 1 TB
Screen 17.3"
GPU Intel UHDe Graphics
OS Windows 11 Pro
Weight 1.7 kg

32 Overall Score
No current retailer price


Snapshot
Pros & Cons
Pros
- Strong storage (65th percentile) 65th
Cons
- Below average portability (8th percentile)
- Below average screen (30th percentile)
- Below average port selection (31st percentile)
- Below average reliability (34th percentile)
The proof
Performance
Specifications
Full Specifications
Processor
| CPU | Intel Core i7 1355U |
| Cores | 10 |
| Frequency | 1.2 GHz |
| L3 Cache | 12 MB |
Graphics
| GPU | Intel UHDe Graphics |
| Type | Integrated |
Memory & Storage
| RAM | 16 GB |
| RAM Generation | DDR5 |
| Storage | 1 TB |
| Storage Type | SSD |
Display
| Size | 17.3" |
| Panel | IPS |
| Brightness | 250 nits |
Connectivity
| USB-C Ports | 1 |
| USB Ports | 2 |
| HDMI | HDMI 1.4b |
| Wi-Fi | Wi-Fi 6 |
| Bluetooth | ✓ |
Physical
| Weight | 1.7 kg / 3.7 lbs |
| OS | Windows 11 Pro |
vs Competition
| Spec | HP Essential 17.3" TPN-Q311 | Apple MacBook Air 13.6" M4 | Lenovo Legion Pro 7i Gen 10 16" | Samsung Galaxy Book5 Pro 14" NP944XHA-KG3US | ASUS ROG Flow Z13 GZ302EA | Dell Premium 14.5" LDA14250-7667SLV-PUS |
|---|---|---|---|---|---|---|
| CPU | Intel Core i7 1355U | Apple M4 | Intel Core Ultra 9 275HX | Intel Core Ultra 7 258V | AMD Ryzen AI Max+ 395 | Intel Core Ultra 7 255H |
| RAM (GB) | 16 | 24 | 32 | 32 | 32 | 32 |
| Storage (GB) | 1024 | 1024 | 1024 | 1024 | 1024 | 1024 |
| Screen | 17.3" | 13.6" 2560x1664 | 16" 2560x1600 | 14" 2880x1800 | 13.4" 2560x1600 | 14.5" 3200x2000 |
| GPU | Intel UHDe Graphics | Apple (10-Core) | NVIDIA GeForce RTX 5070 Ti | Intel Arc Graphics 140V | AMD Radeon 8060S Graphics | Intel Arc Graphics |
| OS | Windows 11 Pro | macOS | Windows 11 Home | Windows 11 Pro | Windows 11 Pro | Windows 11 Home |
| Weight (kg) | 1.7 | 1.2 | 2.7 | 1.2 | 1.2 | 1.7 |
| Battery (Wh) | - | 54 | 99 | 63 | 70 | 62 |
| Compare | Compare | Compare | Compare | Compare |
| Product | CPU | GPU | RAM | Ports | Screen | Portability | Storage | Reliability | Social Proof | Affordability |
|---|---|---|---|---|---|---|---|---|---|---|
| HP Essential 17.3" TPN-Q311 | 46.2 | 47.8 | 49.8 | 30.8 | 30.4 | 7.5 | 65.2 | 33.6 | 44.2 | 45.6 |
| Apple MacBook Air 13.6" M4 Compare | 75.9 | 75.7 | 64.9 | 51 | 87 | 91.4 | 79.2 | 98.3 | 98.7 | 24.6 |
| Lenovo Legion Pro 7i Gen 10 16" Compare | 97.2 | 96.6 | 89 | 97.2 | 95.6 | 9.5 | 79.2 | 82 | 99.7 | 5.5 |
| Samsung Galaxy Book5 Pro 14" NP944XHA-KG3US Compare | 65.8 | 69.7 | 79.5 | 83.1 | 91.5 | 89.5 | 79.2 | 82 | 96.5 | 20 |
| ASUS ROG Flow Z13 GZ302EA Compare | 95.8 | 91.8 | 90.9 | 71 | 86.7 | 94.2 | 79.2 | 60.6 | 44.2 | 9.8 |
| Dell Premium 14.5" LDA14250-7667SLV-PUS Compare | 87.1 | 69.7 | 89 | 65.9 | 97.2 | 61.1 | 65.2 | 33.6 | 96.5 | 14 |
Price
Value & Pricing
Price history
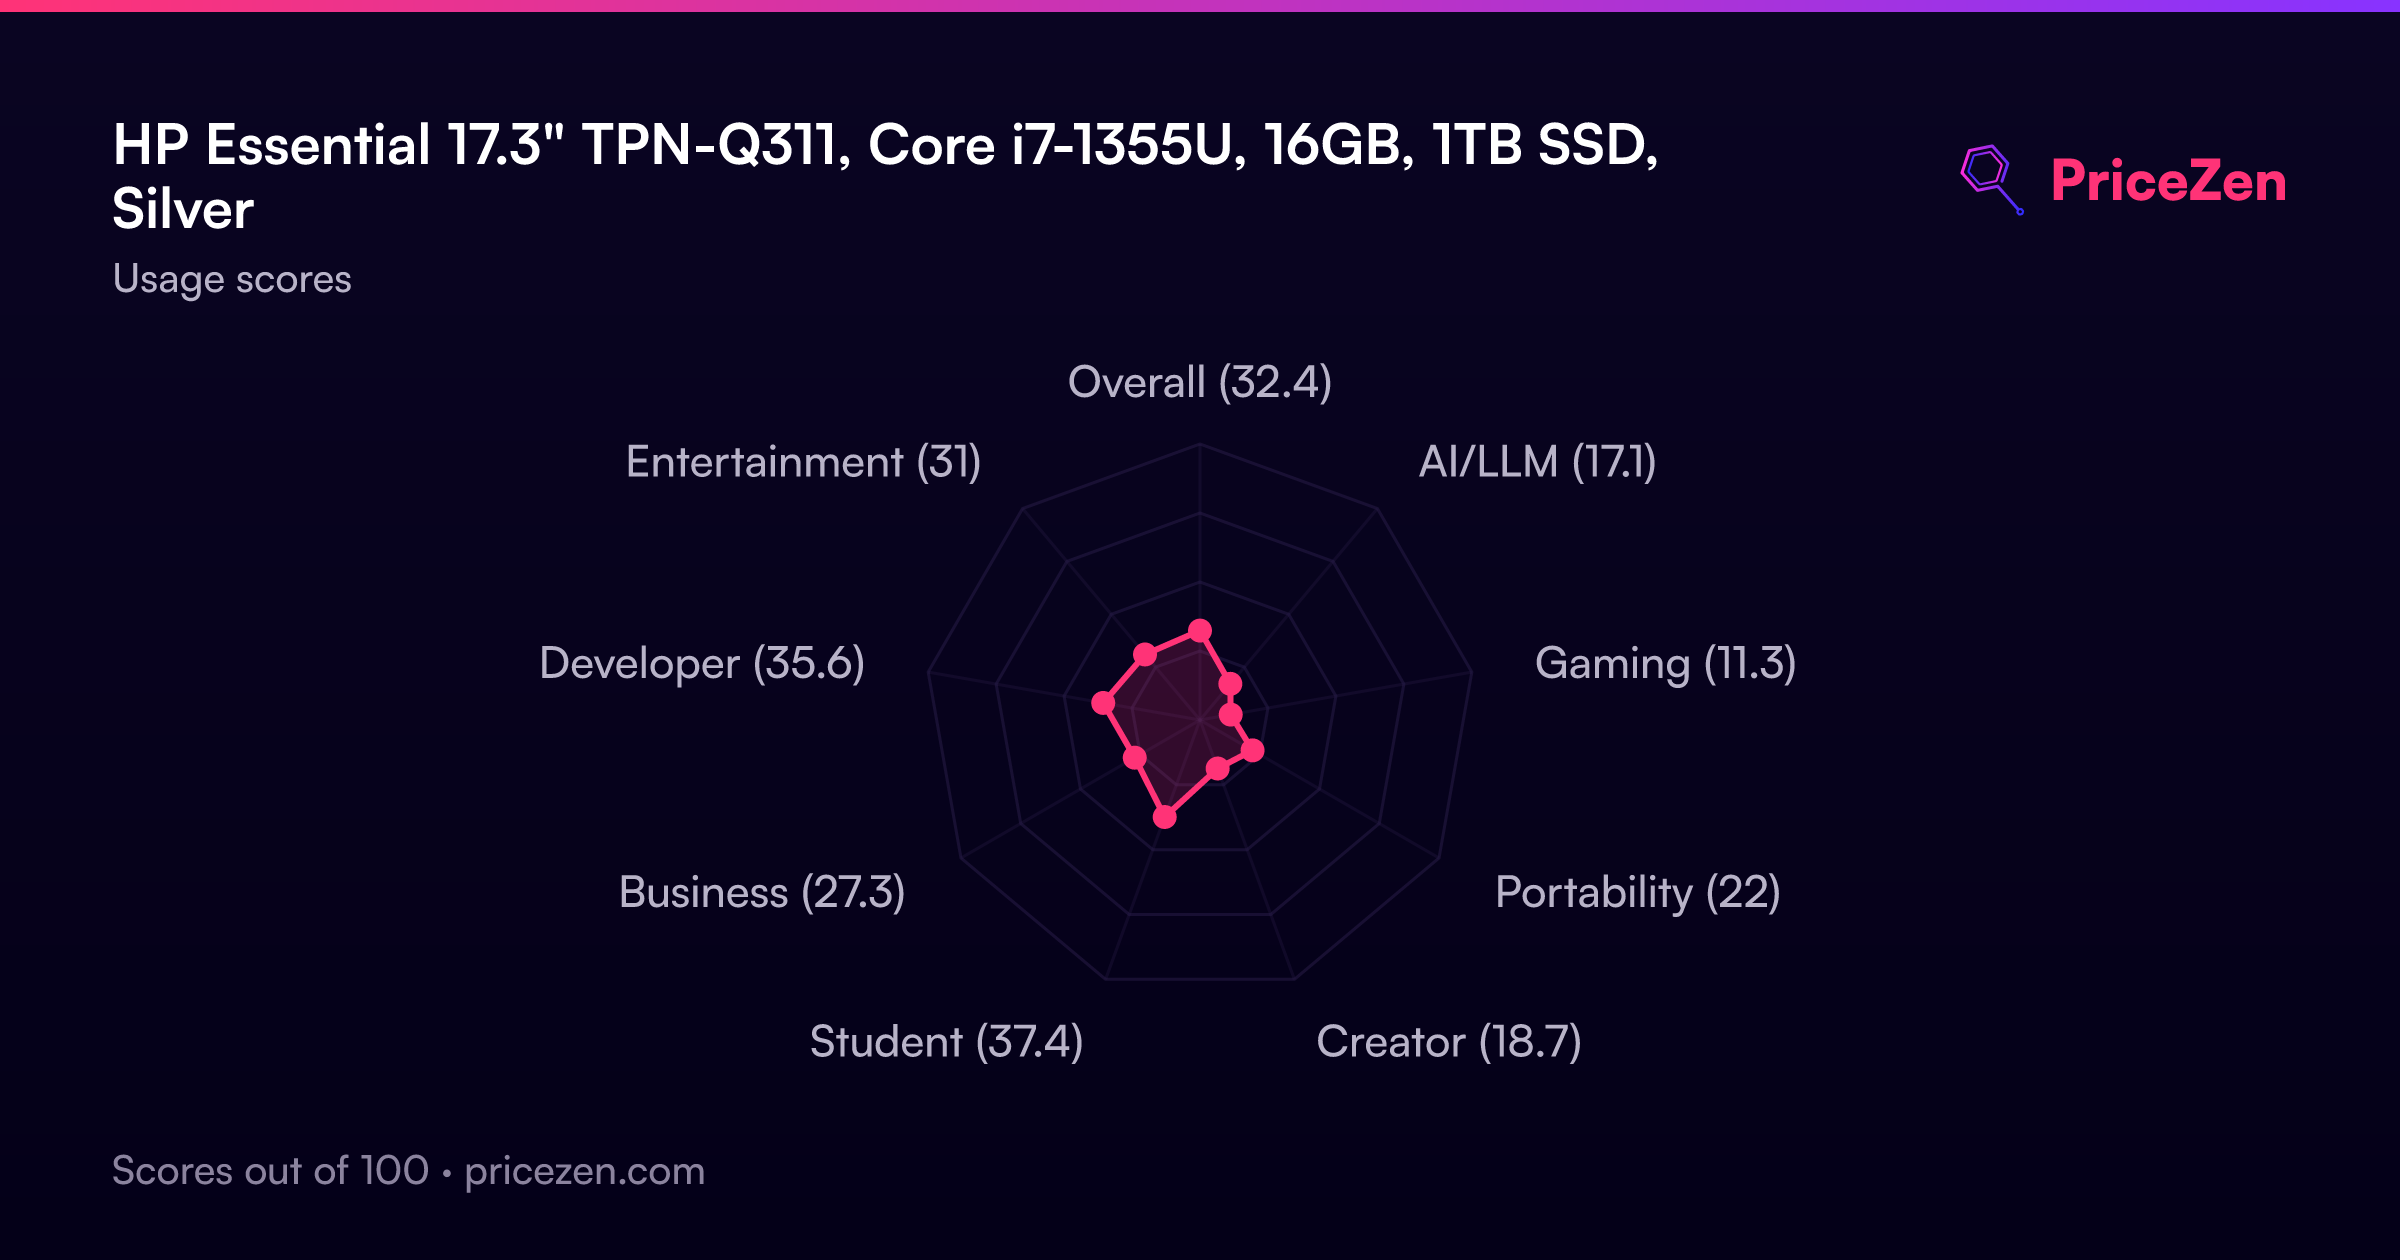
Usage Scores
- Overall32.4
- AI/LLM17.1
- Gaming11.3
- Portability22
- Creator18.7
- Student37.4
- Business27.3
- Developer35.7
- Entertainment31
A full written review is coming soon. The specs, scores, prices and charts above are always up to date.