Apple MacBook Air 13.3" 2015, Core i5, 4GB, 128GB SSD, Silver
CPU Intel 5th Generation Core i5
RAM 4 GB
Storage 128 GB
Screen 13.3" 1440x900
GPU Intel HD Graphics 6000
OS macOS
Weight 1.4 kg

39 Overall Score
Price $210
Snapshot
Pros & Cons
Pros
- Strong reliability (98th percentile) 98th
- Strong affordability (97th percentile) 97th
- Strong portability (94th percentile) 94th
- Strong social proof (80th percentile) 80th
Cons
- Below average ram (0th percentile)
- Below average cpu (4th percentile)
- Below average storage (7th percentile)
- Below average screen (8th percentile)
What owners think
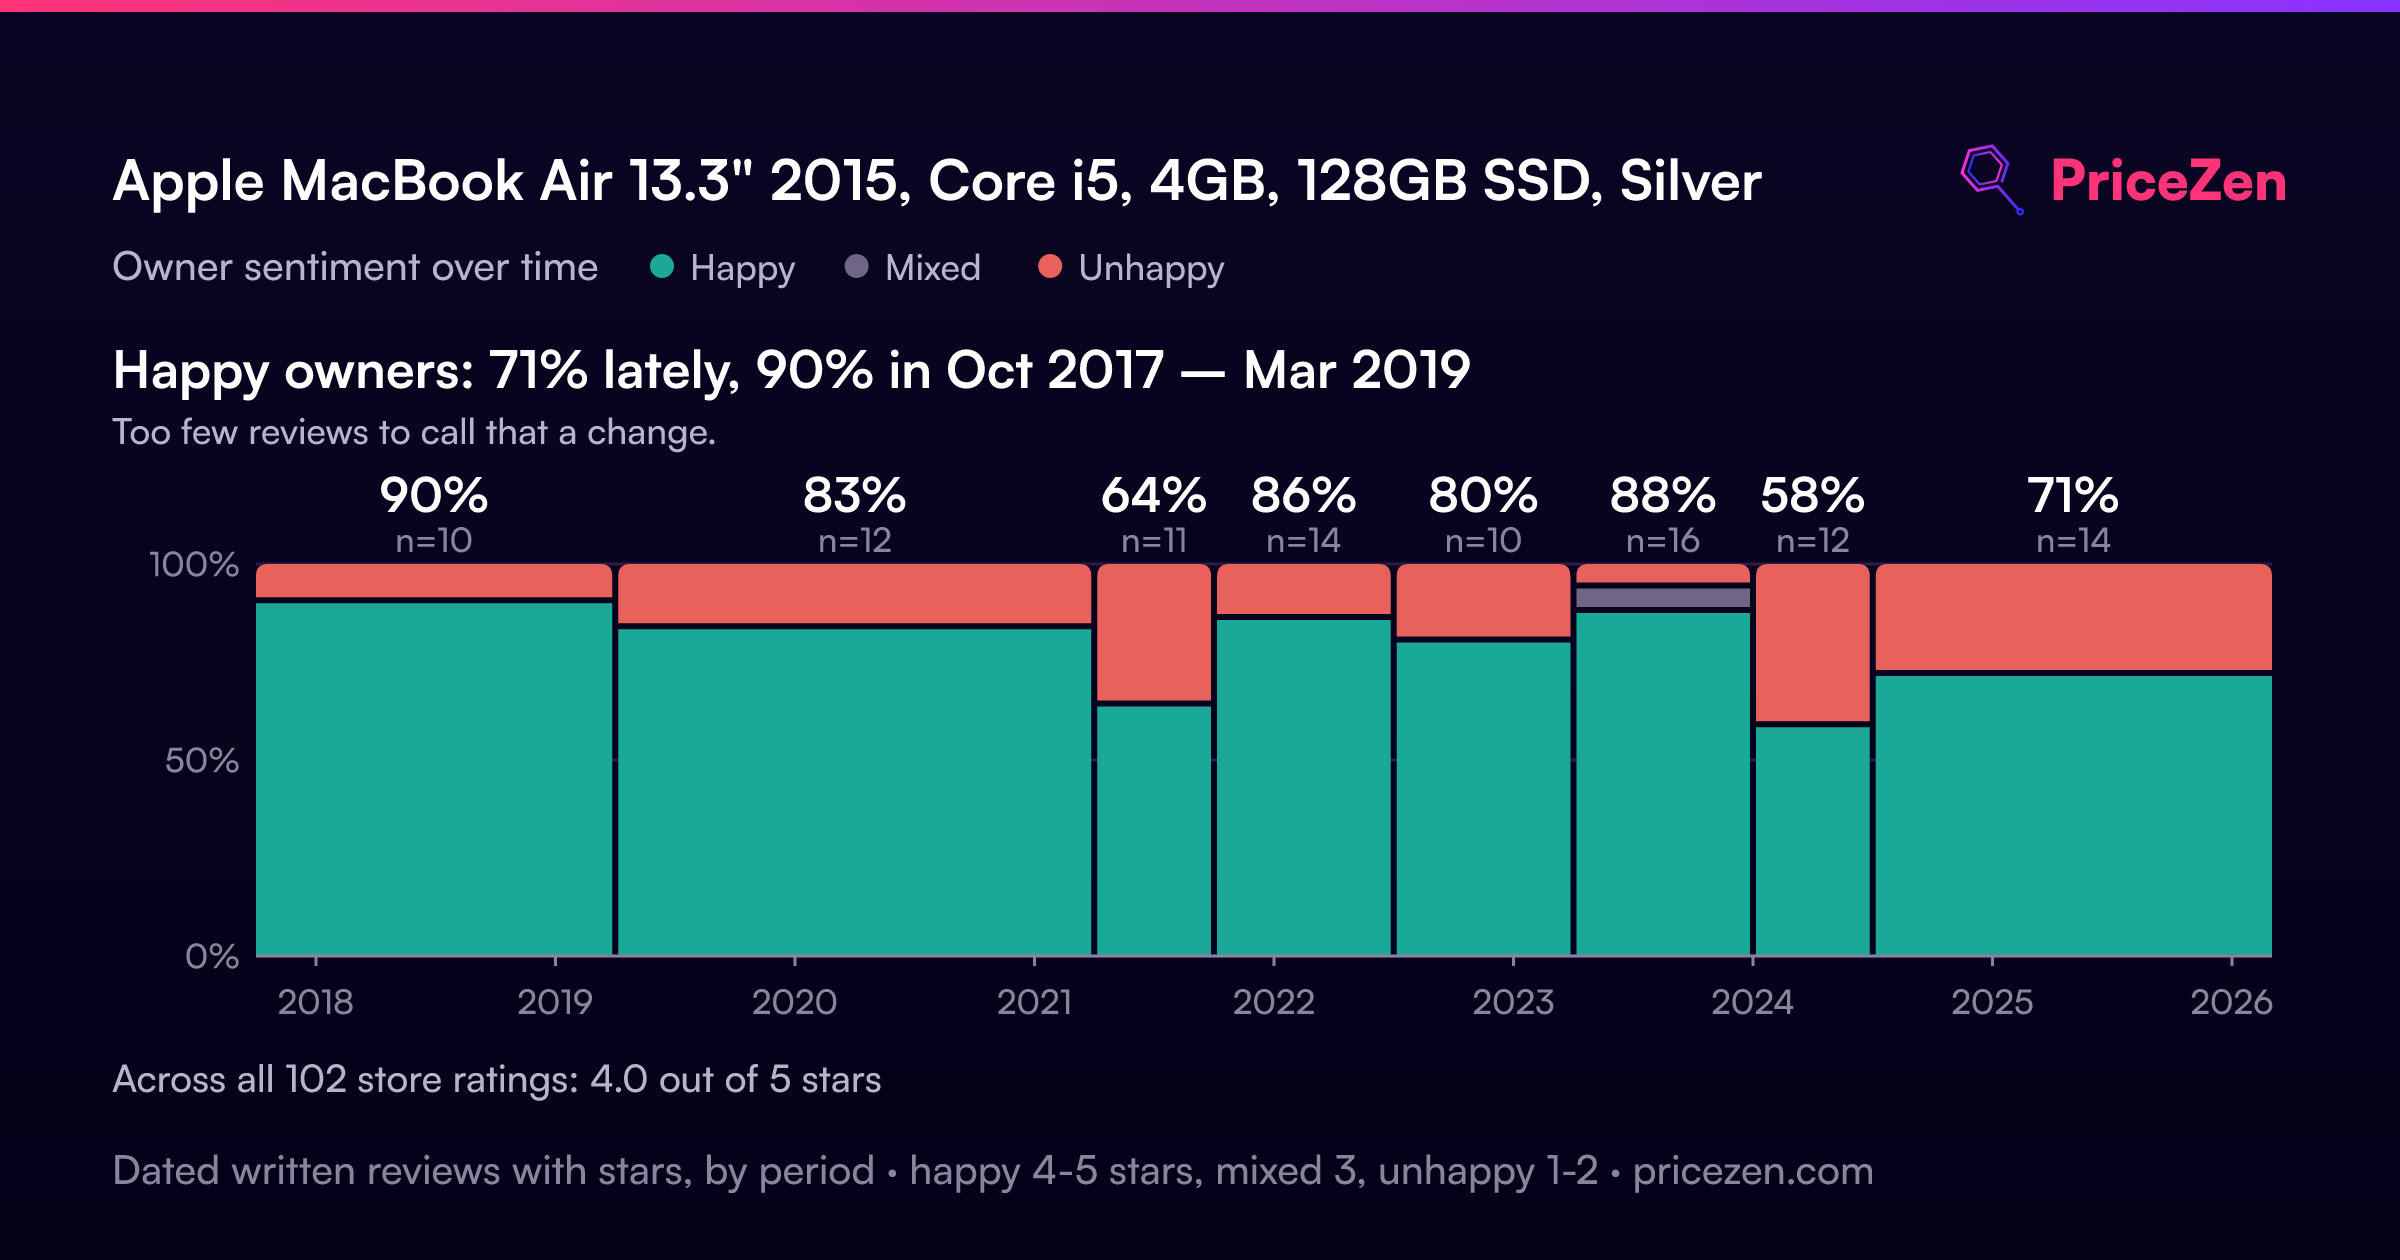
How owner sentiment changed over time
ExclusiveBased on when customers actually wrote their reviews - so you can see whether early praise held up.
Happy owners: 71% lately, 90% in Oct 2017 – Mar 2019
Too few reviews to call that a change.
Across all 102 store ratings: 4.0★. The chart counts the 99 written reviews with stars and their own date.
2 written reviews without stars are left out of the trend.
Show the numbers
| Period | Reviews | Happy | Mixed | Unhappy | Happy share |
|---|---|---|---|---|---|
| Oct 2017 – Mar 2019 | 10 | 9 | 0 | 1 | 90% |
| Apr 2019 – Mar 2021 | 12 | 10 | 0 | 2 | 83% |
| Apr – Sep 2021 | 11 | 7 | 0 | 4 | 64% |
| Oct 2021 – Jun 2022 | 14 | 12 | 0 | 2 | 86% |
| Jul 2022 – Mar 2023 | 10 | 8 | 0 | 2 | 80% |
| Apr – Dec 2023 | 16 | 14 | 1 | 1 | 88% |
| Jan – Jun 2024 | 12 | 7 | 0 | 5 | 58% |
| Jul 2024 – Feb 2026 | 14 | 10 | 0 | 4 | 71% |
Each column joins calendar quarters until it holds at least 10 reviews with stars and their own date. Happy = 4-5★, mixed = 3★, unhappy = 1-2★.
The proof
Performance
Specifications
Full Specifications
Processor
| CPU | Intel 5th Generation Core i5 |
| Cores | 2 |
| Frequency | 1.6 GHz |
Graphics
| GPU | Intel HD Graphics 6000 |
| Type | Integrated |
| VRAM Type | GDDR6 |
Memory & Storage
| RAM | 4 GB |
| RAM Generation | LPDDR3 |
| Storage | 128 GB |
| Storage Type | SSD |
Display
| Size | 13.3" |
| Resolution | 1440x900 |
| Panel | IPS |
| Refresh Rate | 60 Hz |
Connectivity
| USB-C Ports | 1 |
| USB Ports | 2 |
| Thunderbolt | Thunderbolt 2 |
| Wi-Fi | Wi-Fi 4 |
| Bluetooth | Bluetooth 4.0 |
Physical
| Weight | 1.4 kg / 3.0 lbs |
| OS | macOS |
vs Competition
| Spec | Apple MacBook Air 13.3" | Lenovo ThinkBook 16 G7 | HP OmniBook X Flip | MSI Summit 13.3" A1MTG-001US | Dell Latitude 14" 7430 | ASUS Vivobook 14" X1407QA-V14.X116512 |
|---|---|---|---|---|---|---|
| CPU | Intel 5th Generation Core i5 | AMD Ryzen 5 7533HS | AMD Ryzen 5 430 | Intel Core Ultra 7 155H | Intel Core i7 1265U | Snapdragon X X126100 |
| RAM (GB) | 4 | 16 | 16 | 16 | 32 | 16 |
| Storage (GB) | 128 | 1024 | 512 | 1024 | 256 | 512 |
| Screen | 13.3" 1440x900 | 16" 1920x1200 | 14" 1920x1200 | 13.3" 1920x1200 | 14" 1920x1080 | 14" 1920x1200 |
| GPU | Intel HD Graphics 6000 | AMD Radeon 660M | AMD Radeon 840M | Intel Arc Graphics | Intel Iris Xe Graphics | Qualcomm Adreno |
| OS | macOS | Windows 11 Pro | Windows 11 Home | Windows 11 Home | Windows 11 Pro | Windows 11 Home |
| Weight (kg) | 1.4 | 1.7 | 1.4 | 1.4 | 1.2 | 1.5 |
| Battery (Wh) | - | 45 | 59 | 70 | 41 | - |
| Compare | Compare | Compare | Compare | Compare |
| Product | CPU | GPU | RAM | Ports | Screen | Portability | Storage | Reliability | Social Proof | Affordability |
|---|---|---|---|---|---|---|---|---|---|---|
| Apple MacBook Air 13.3" | 3.9 | 17.2 | 0.2 | 35.7 | 7.9 | 93.5 | 7.3 | 98.3 | 79.7 | 96.6 |
| Lenovo ThinkBook 16 G7 Compare | 50.2 | 59.1 | 54.6 | 89.3 | 66.2 | 32.4 | 79.2 | 82 | 88.3 | 66.8 |
| HP OmniBook X Flip Compare | 43.4 | 60.8 | 63.5 | 77.2 | 77.8 | 80.1 | 35.7 | 33.6 | 82.9 | 33.2 |
| MSI Summit 13.3" A1MTG-001US Compare | 78.1 | 69.7 | 49.8 | 16.7 | 66.2 | 93.5 | 79.2 | 60.6 | 0 | 68 |
| Dell Latitude 14" 7430 Compare | 41.6 | 47.7 | 76.7 | 83.1 | 53 | 88 | 27.7 | 33.6 | 51.3 | 77.9 |
| ASUS Vivobook 14" X1407QA-V14.X116512 Compare | 52.2 | 13.2 | 62.5 | 71 | 56.3 | 75.5 | 35.7 | 60.6 | 91.3 | 68.6 |
Price
Value & Pricing
From $210
Best Buy 1 offer From $210
Price history
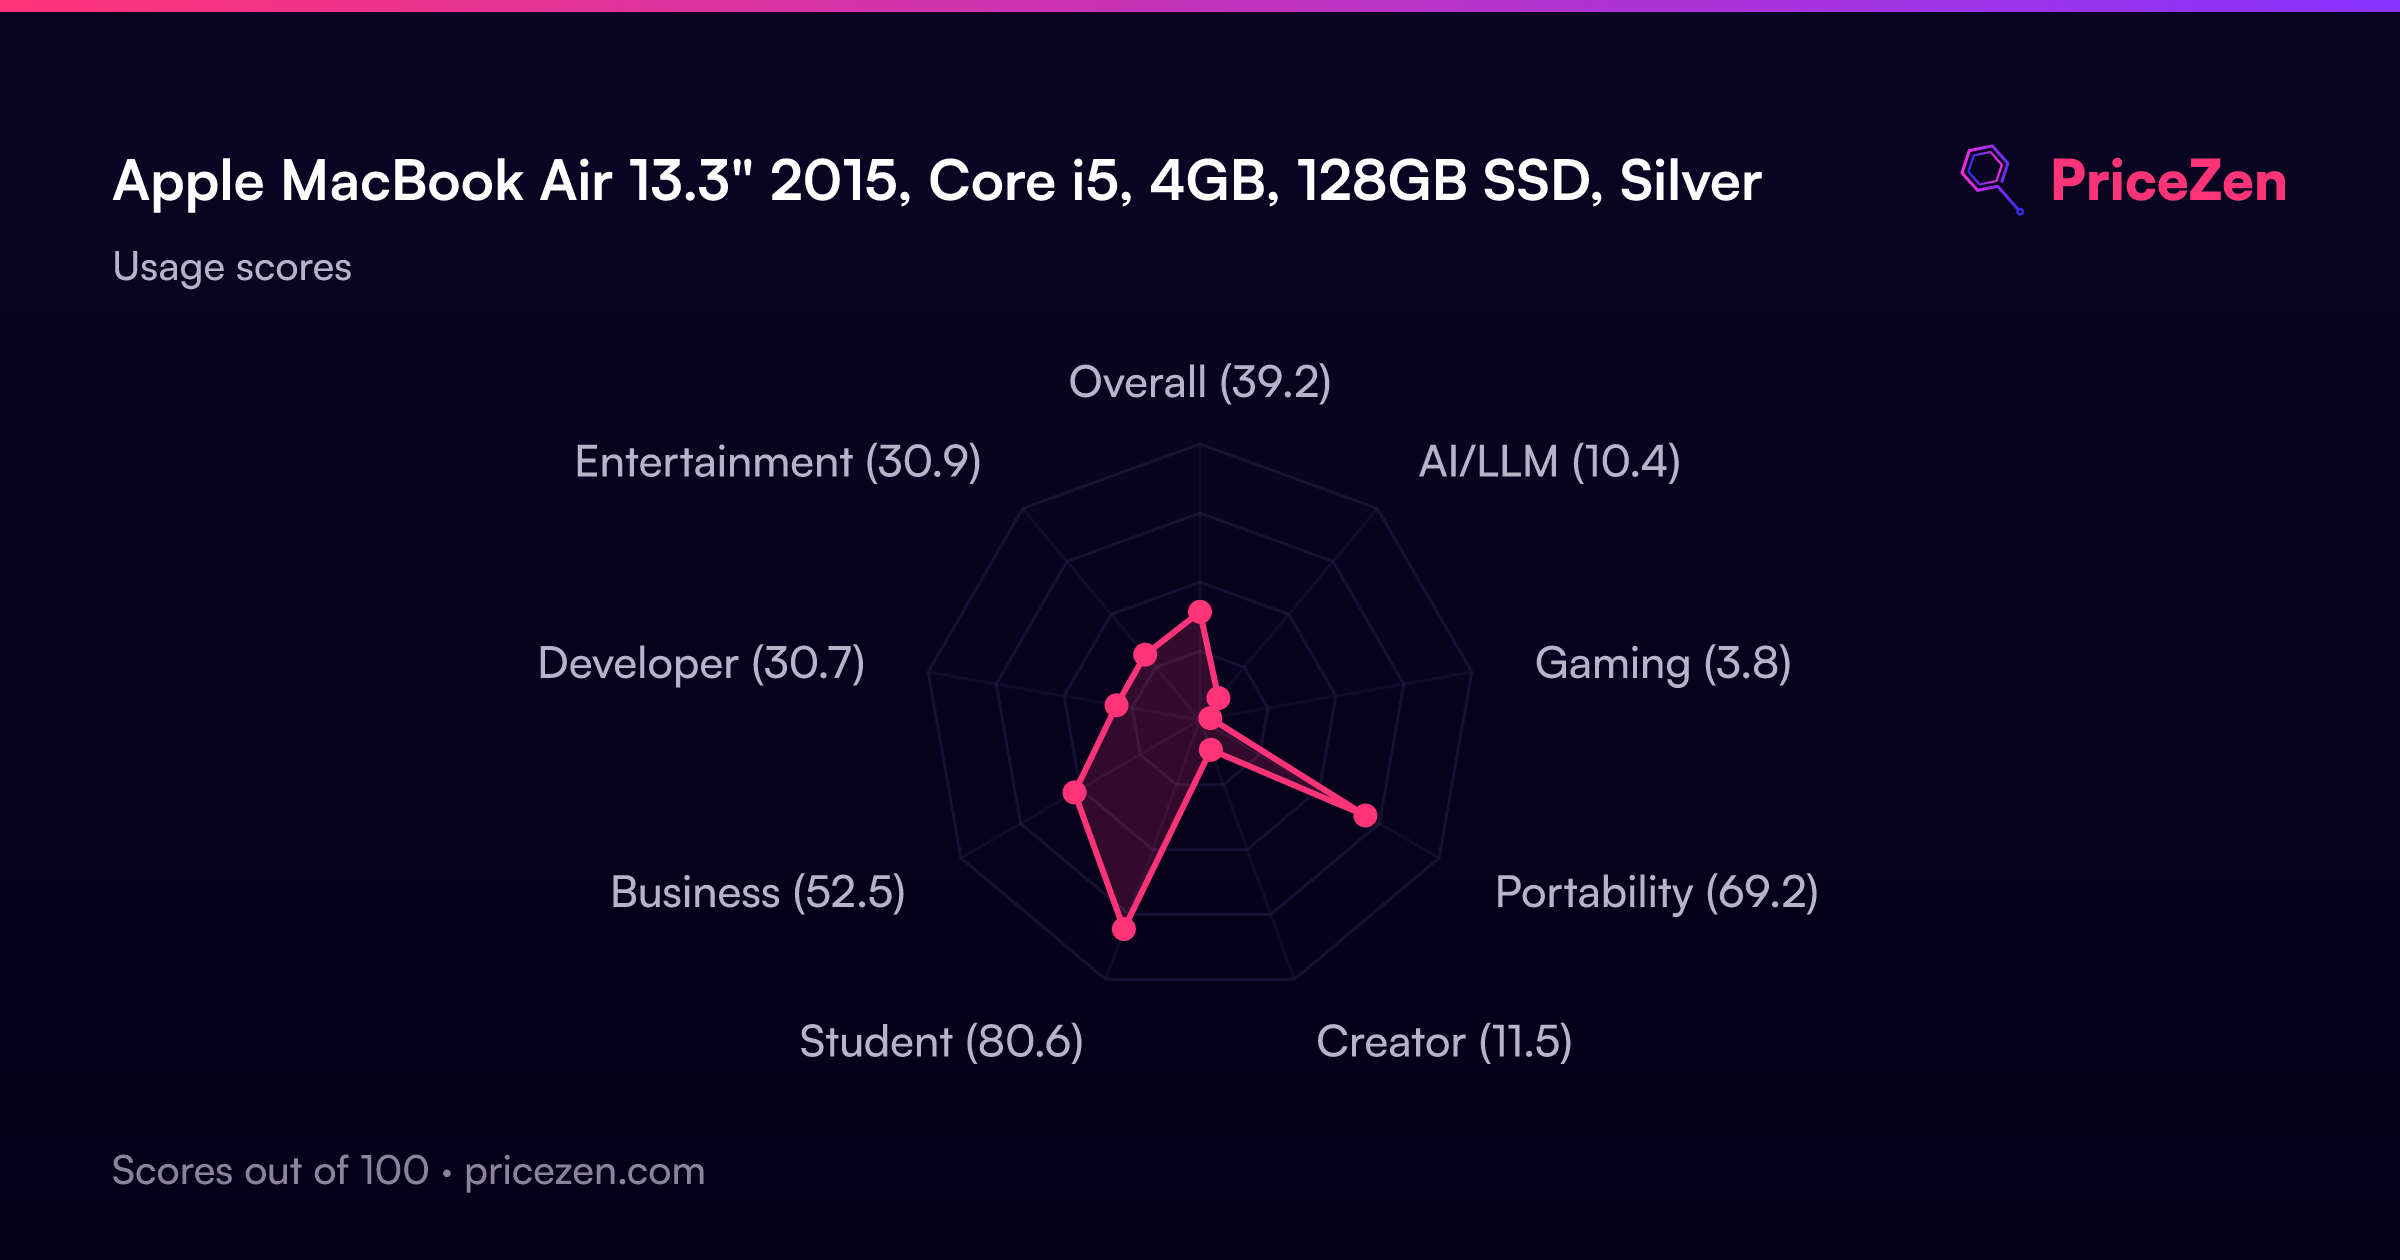
Usage Scores
- Overall39.2
- AI/LLM10.4
- Gaming3.8
- Portability69.2
- Creator11.5
- Student80.6
- Business52.5
- Developer30.7
- Entertainment30.9
A full written review is coming soon. The specs, scores, prices and charts above are always up to date.
Other Configurations12
MacBook Air 13.3"Intel Core i5 5350U8GB128GBSilver$80MacBook Air 13.3"Intel 5th Generation Core i58GB256GBSilver$120MacBook Air 13.3"Intel 5th Generation Core i54GB256GBSilver$180MacBook Air 13.3"Intel Core i5 5350U8GB128GBSilver$220MacBook Air 13.3"Intel 10th Generation Core i38GB256GBSpace Gray$330MacBook Air 13.3"Intel 8th Generation Core i58GB128GBGold$400MacBook Air 13.3"Intel 8th Generation Core i58GB128GBSpace Gray$435MacBook Air 13.3"Intel 10th Generation Core i58GB512GBGold$500MacBook Air 13.3"Intel Core i5 i58GB256GBSilver$500