HP Pro Mini 400 G9, Core i7-12700T, 16GB, 512GB SSD
CPU Intel Core i7 12700T
RAM 16 GB
Storage 512 GB
GPU Intel UHD 770 Graphics
Form Factor mini
OS Windows 11 Pro

46 Puntuación global
Sin precio actual de tiendas


Resumen
Ventajas y desventajas
Ventajas
- Strong reliability (70th percentile) 70th
Desventajas
- Below average port selection (5th percentile)
- Below average storage (29th percentile)
- Below average ram (31st percentile)
- Below average social proof (34th percentile)
Las pruebas
Rendimiento
Especificaciones
Especificaciones completas
Processor
| CPU | Intel Core i7 12700T |
| Cores | 12 |
| Frequency | 1.4 GHz |
| L3 Cache | 25 MB |
Graphics
| GPU | Intel UHD 770 Graphics |
| Type | Integrated |
Memory & Storage
| RAM | 16 GB |
| Storage | 512 GB |
| Storage Type | SSD |
Build
| Form Factor | mini |
| Weight | 3.2 kg / 7.0 lbs |
Connectivity
| Bluetooth | ✓ |
System
| OS | Windows 11 Pro |
Frente a la competencia
| Spec | HP Pro Mini 400 G9 | Apple Mac Studio M5 Ultra | Lenovo ThinkStation P3 Tower Gen 2 | CLX SET TGMSETRTU5204BM | MSI Aegis Z2 C7NVP-1449US | ASUS ROG NUC RNUC15JNK9X489AU |
|---|---|---|---|---|---|---|
| CPU | Intel Core i7 12700T | Apple M5 Ultra | Intel Core Ultra 9 285 | Intel Core i9 14900KF | AMD Ryzen 7 7700 | Intel Core Ultra 9 275HX |
| RAM (GB) | 16 | 256 | 128 | 64 | 32 | 32 |
| Storage (GB) | 512 | 1024 | 2048 | 8192 | 1024 | 1024 |
| GPU | Intel UHD 770 Graphics | Apple (64-Core) | NVIDIA RTX 4000 Ada Generation | NVIDIA GeForce RTX 5070 | NVIDIA GeForce RTX 5070 | NVIDIA GeForce RTX 5070 |
| Form Factor | mini | mini | workstation | mid-tower | mid-tower | mini |
| Psu W | - | 480 | 750 | 850 | 750 | 330 |
| OS | Windows 11 Pro | macOS | Windows 11 Pro | Windows 11 Home | Windows 11 Home | Windows 11 Home |
| Compare | Compare | Compare | Compare | Compare |
| Producto | CPU | GPU | RAM | Puertos | Almacenamiento | Fiabilidad | Valoración social |
|---|---|---|---|---|---|---|---|
| HP Pro Mini 400 G9 | 53 | 46.3 | 31.4 | 5.3 | 29.3 | 69.9 | 34.2 |
| Apple Mac Studio M5 Ultra Compare | 99.8 | 100 | 99.8 | 88.9 | 68.9 | 99.3 | 0 |
| Lenovo ThinkStation P3 Tower Gen 2 Compare | 94 | 86 | 99.2 | 68.7 | 90.1 | 69.9 | 92.1 |
| CLX SET TGMSETRTU5204BM Compare | 94.9 | 90.8 | 96.5 | 84.1 | 99.1 | 11.5 | 94.8 |
| MSI Aegis Z2 C7NVP-1449US Compare | 74.7 | 90.8 | 87.1 | 93.6 | 68.9 | 37.1 | 82.8 |
| ASUS ROG NUC RNUC15JNK9X489AU Compare | 92.9 | 90.8 | 90.4 | 92.1 | 68.9 | 37.1 | 95.6 |
Precio
Relación calidad-precio
Seguimos los precios de este producto desde el 30 sept 2026. El gráfico aparecerá cuando tengamos más datos.
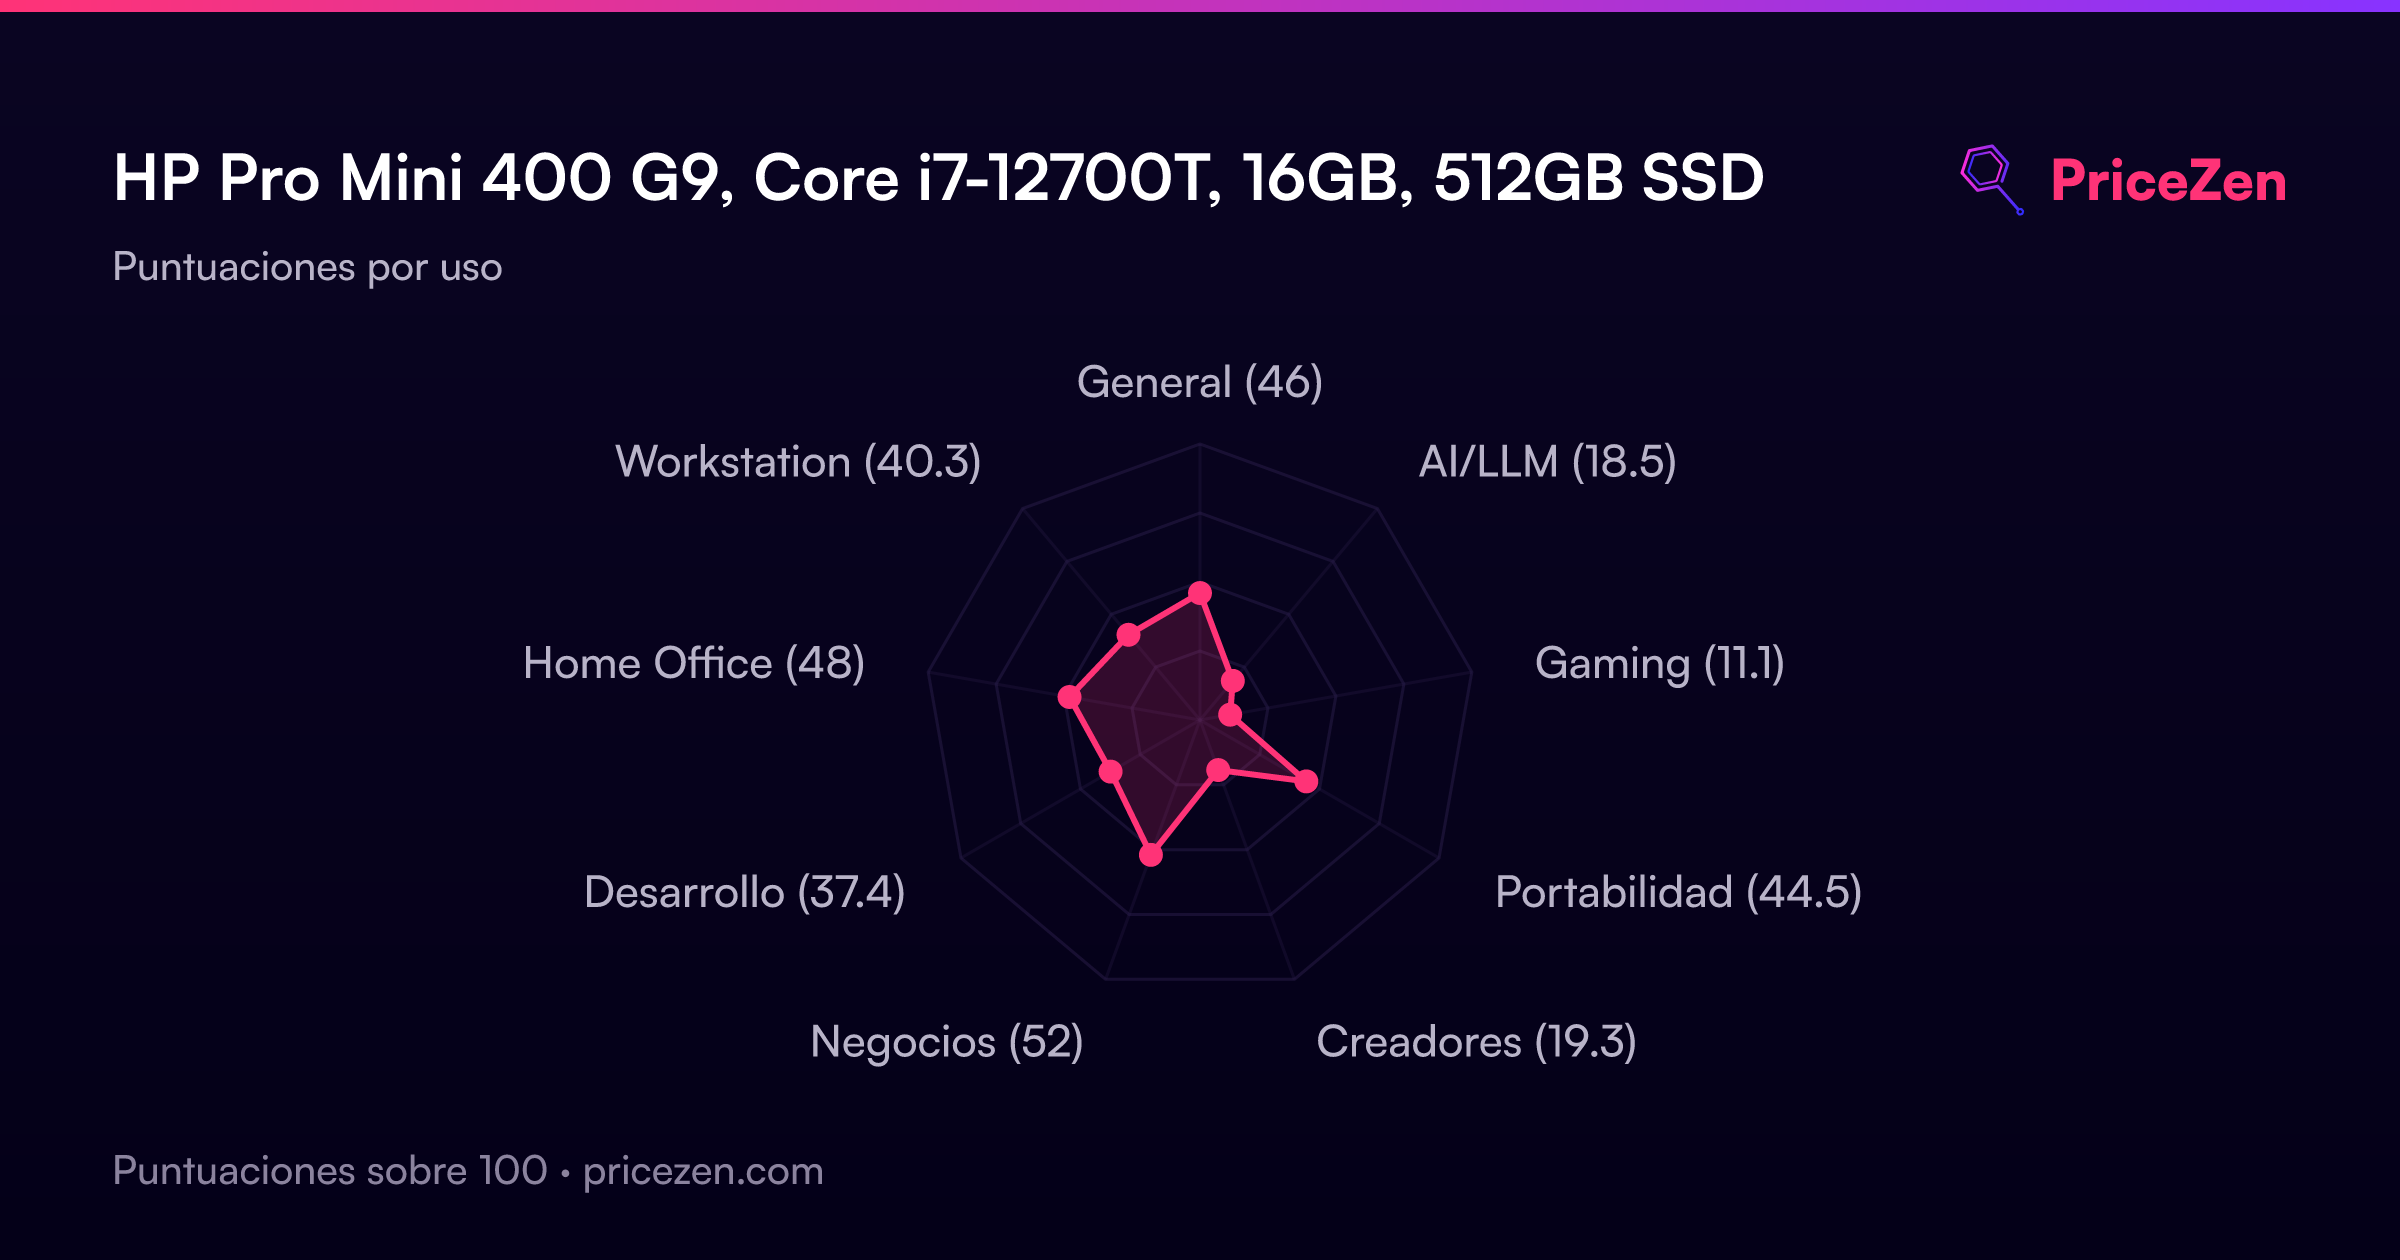
Puntuaciones por uso
- General46
- AI/LLM18.5
- Gaming11.1
- Portabilidad44.5
- Creadores19.3
- Negocios52
- Desarrollo37.3
- Home Office48
- Workstation40.2
Pronto habrá un análisis completo. Las especificaciones, puntuaciones, precios y gráficos de arriba siempre están actualizados.
Otras configuraciones17
Pro 400 G9Celeron8GB256GB14.899 MXNPro Mini 400 G9Intel Core i7 12700T16GB1TBCarbon Black18.969 MXNPro Mini 400 G9Intel Core i7 14700T16GB256GBBlack28.699 MXNPro Mini 400 G9Intel Core i7 14700T16GB512GBBlack39.084 MXNPro Mini 400 G9Intel Core i7 12700T32GB1TB42.007 MXNPro Mini A70P7UT#ABAIntel Core i5-14500T16GB512GBJack Black45.590 MXNPro Mini 400 G9Intel Core i5 14500T16GB256GBJack blackPro Mini 400 G9Intel Core i5-14500T8GB256GBJack blackPro Mini 400 G9Intel Core i7 12700T16GB512GBBlack
Ver las 17 configuraciones
Pro Mini 400 G9Intel Core i5-14500T32GB1TBBlackPro Mini 400 G9Intel Core i7 12700T16GB512GBCarbon BlackPro Mini 400 G9 MiniIntel Core i7 12700T64GB1TBCarbon BlackPro Mini 400 G9Intel Core i7 12700T32GB1TBCarbon BlackPro Mini 400 G9Intel Core i5 13500T16GB512GBBlackPro Mini 400 G9Intel Core i5 12500T16GB512GBBlackPro 400 G9Intel Celeron G6900T16GB256GBPro Mini 400 G9Intel Core i5 13500T32GB1TBBlack