ASUS TUF-RTX4090-24G-GAMING
Equipped with 16,384 CUDA cores and 24GB of GDDR6X memory, this RTX 4090 delivers a 38,098 PassMark score for dominant 4K gaming and ray tracing. Its military-grade capacitors, metal exoskeleton, and axial-tech fans with dual ball bearings provide a 23% airflow increase for sustained, reliable cooling under a 450W load. This card is best for 4K gamers and ray-tracing enthusiasts who prioritize a durable, cool-running build over compact size.

No current retailer price


Snapshot
Pros & Cons
Pros
- Strong rt (99th percentile) 99th
- Strong compute (97th percentile) 97th
- Strong raster (97th percentile) 97th
- Strong vram (93rd percentile) 93rd
Cons
- Below average affordability (6th percentile)
- Below average social proof (18th percentile)
What owners think
How owner sentiment changed over time
ExclusiveBased on when customers actually wrote their reviews - so you can see whether early praise held up.
Happy owners: 88% lately, 88% in Jan – Mar 2026
Too few reviews to call that a change.
6 written reviews without stars are left out of the trend.
Show the numbers
| Period | Reviews | Happy | Mixed | Unhappy | Happy share |
|---|---|---|---|---|---|
| Jan – Mar 2026 | 25 | 22 | 1 | 2 | 88% |
| Apr – May 2026 | 25 | 22 | 1 | 2 | 88% |
Each column joins calendar quarters until it holds at least 10 reviews with stars and their own date. Happy = 4-5★, mixed = 3★, unhappy = 1-2★.
The proof
Performance
Specifications
Full Specifications
Chipset
| GPU Chipset | GeForce RTX 4090 |
| Brand | NVIDIA |
| Architecture | Ada Lovelace |
| Class | consumer |
| Process | 5 |
Memory
| VRAM | 24 GB |
| Memory Type | GDDR6X |
| Memory Bus | 384 |
| Bandwidth | 576 |
Compute
| CUDA Cores | 16384 |
| Tensor Cores | 304 |
| RT Cores | 76 |
| Base Clock | 2520 |
| Boost Clock | 2550 |
| FP16 TFLOPS | 32.98 |
| FP32 TFLOPS | 32.98 |
Performance
| PassMark G3D | 38059 |
| GPU Compute | 26267 |
Power & Cooling
| TDP | 450 |
| Recommended PSU | 1000 |
| Power Connectors | 1 x 16-Pin |
| Cooler | Triple Fan |
| Fans | 3 |
Connectivity
| Interface | PCI Express 4.0 |
| DisplayPort | 3 |
| HDMI | 2 |
| Max Displays | 4 |
| Max Resolution | 7680 x 4320 |
Physical
| Length | 348 |
| Slot Width | 3.65 |
| Form Factor | ATX |
| Weight | 3.3 kg / 7.4 lbs |
Features
| Ray Tracing | Yes |
| Upscaling | DLSS |
| AV1 Encode | Yes |
| VR Ready | Yes |
| DirectX | 12 Ultimate |
| RGB | No |
vs Competition
| Spec | ASUS TUF-RTX4090-24G-GAMING | Gigabyte GeForce RTX 5070 Ti Eagle Ice | MSI GeForce RTX 5070 Ti Ventus 3X OC | ZOTAC GeForce RTX 5080 APOCALYPSE | PNY GeForce RTX 5080 ARGB OC | Sapphire Radeon RX 9070 XT PULSE |
|---|---|---|---|---|---|---|
| Chipset | GeForce RTX 4090 | GeForce RTX 5070 Ti | GeForce RTX 5070 Ti | GeForce RTX 5080 | GeForce RTX 5080 | Radeon RX 9070 XT |
| Vram | 24GB GDDR6X | 16GB GDDR7 | 16GB GDDR7 | 16GB GDDR7 | 16GB GDDR7 | 16GB GDDR6 |
| Boost Clock Mhz | 2550 | 2542 | 2482 | 2730 | 2620 | 2970 |
| Tdp W | 450 | 300 | 300 | 360 | 360 | 304 |
| Memory Bus Bits | 384 | 256 | 256 | 256 | 256 | 256 |
| Ray Tracing | true | true | true | true | true | true |
| GPU Class | consumer | consumer | consumer | consumer | consumer | consumer |
| Compare | Compare | Compare | Compare | Compare |
| Product | AI | Rt | Vram | Raster | Compute | Feature | Thermal | User Sentiment | Efficiency | Connectivity | Social Proof | Affordability |
|---|---|---|---|---|---|---|---|---|---|---|---|---|
| ASUS TUF-RTX4090-24G-GAMING | 92.6 | 99 | 93.2 | 96.8 | 97.1 | 89 | 91.6 | 58.1 | 39.4 | 77.9 | 17.8 | 5.8 |
| Gigabyte GeForce RTX 5070 Ti Eagle Ice Compare | 79.6 | 88.6 | 86 | 89 | 88.2 | 96 | 91.6 | 85.4 | 72.2 | 94.1 | 93.3 | 26.8 |
| MSI GeForce RTX 5070 Ti Ventus 3X OC Compare | 79.6 | 92.4 | 86 | 89 | 88.2 | 96 | 91.6 | 85.4 | 72.2 | 94.1 | 83.8 | 23 |
| ZOTAC GeForce RTX 5080 APOCALYPSE Compare | 85.7 | 97.5 | 89 | 94.5 | 93.5 | 96 | 91.6 | 99.5 | 57.1 | 94.1 | 98.7 | 20.2 |
| PNY GeForce RTX 5080 ARGB OC Compare | 85.7 | 97.5 | 89 | 94.5 | 93.5 | 96 | 91.6 | 45.4 | 57.1 | 94.1 | 74.8 | 14.4 |
| Sapphire Radeon RX 9070 XT PULSE Compare | 89.3 | 84.7 | 73.8 | 75.3 | 90.2 | 96 | 72.3 | 96 | 45.7 | 88.8 | 93.3 | 43.3 |
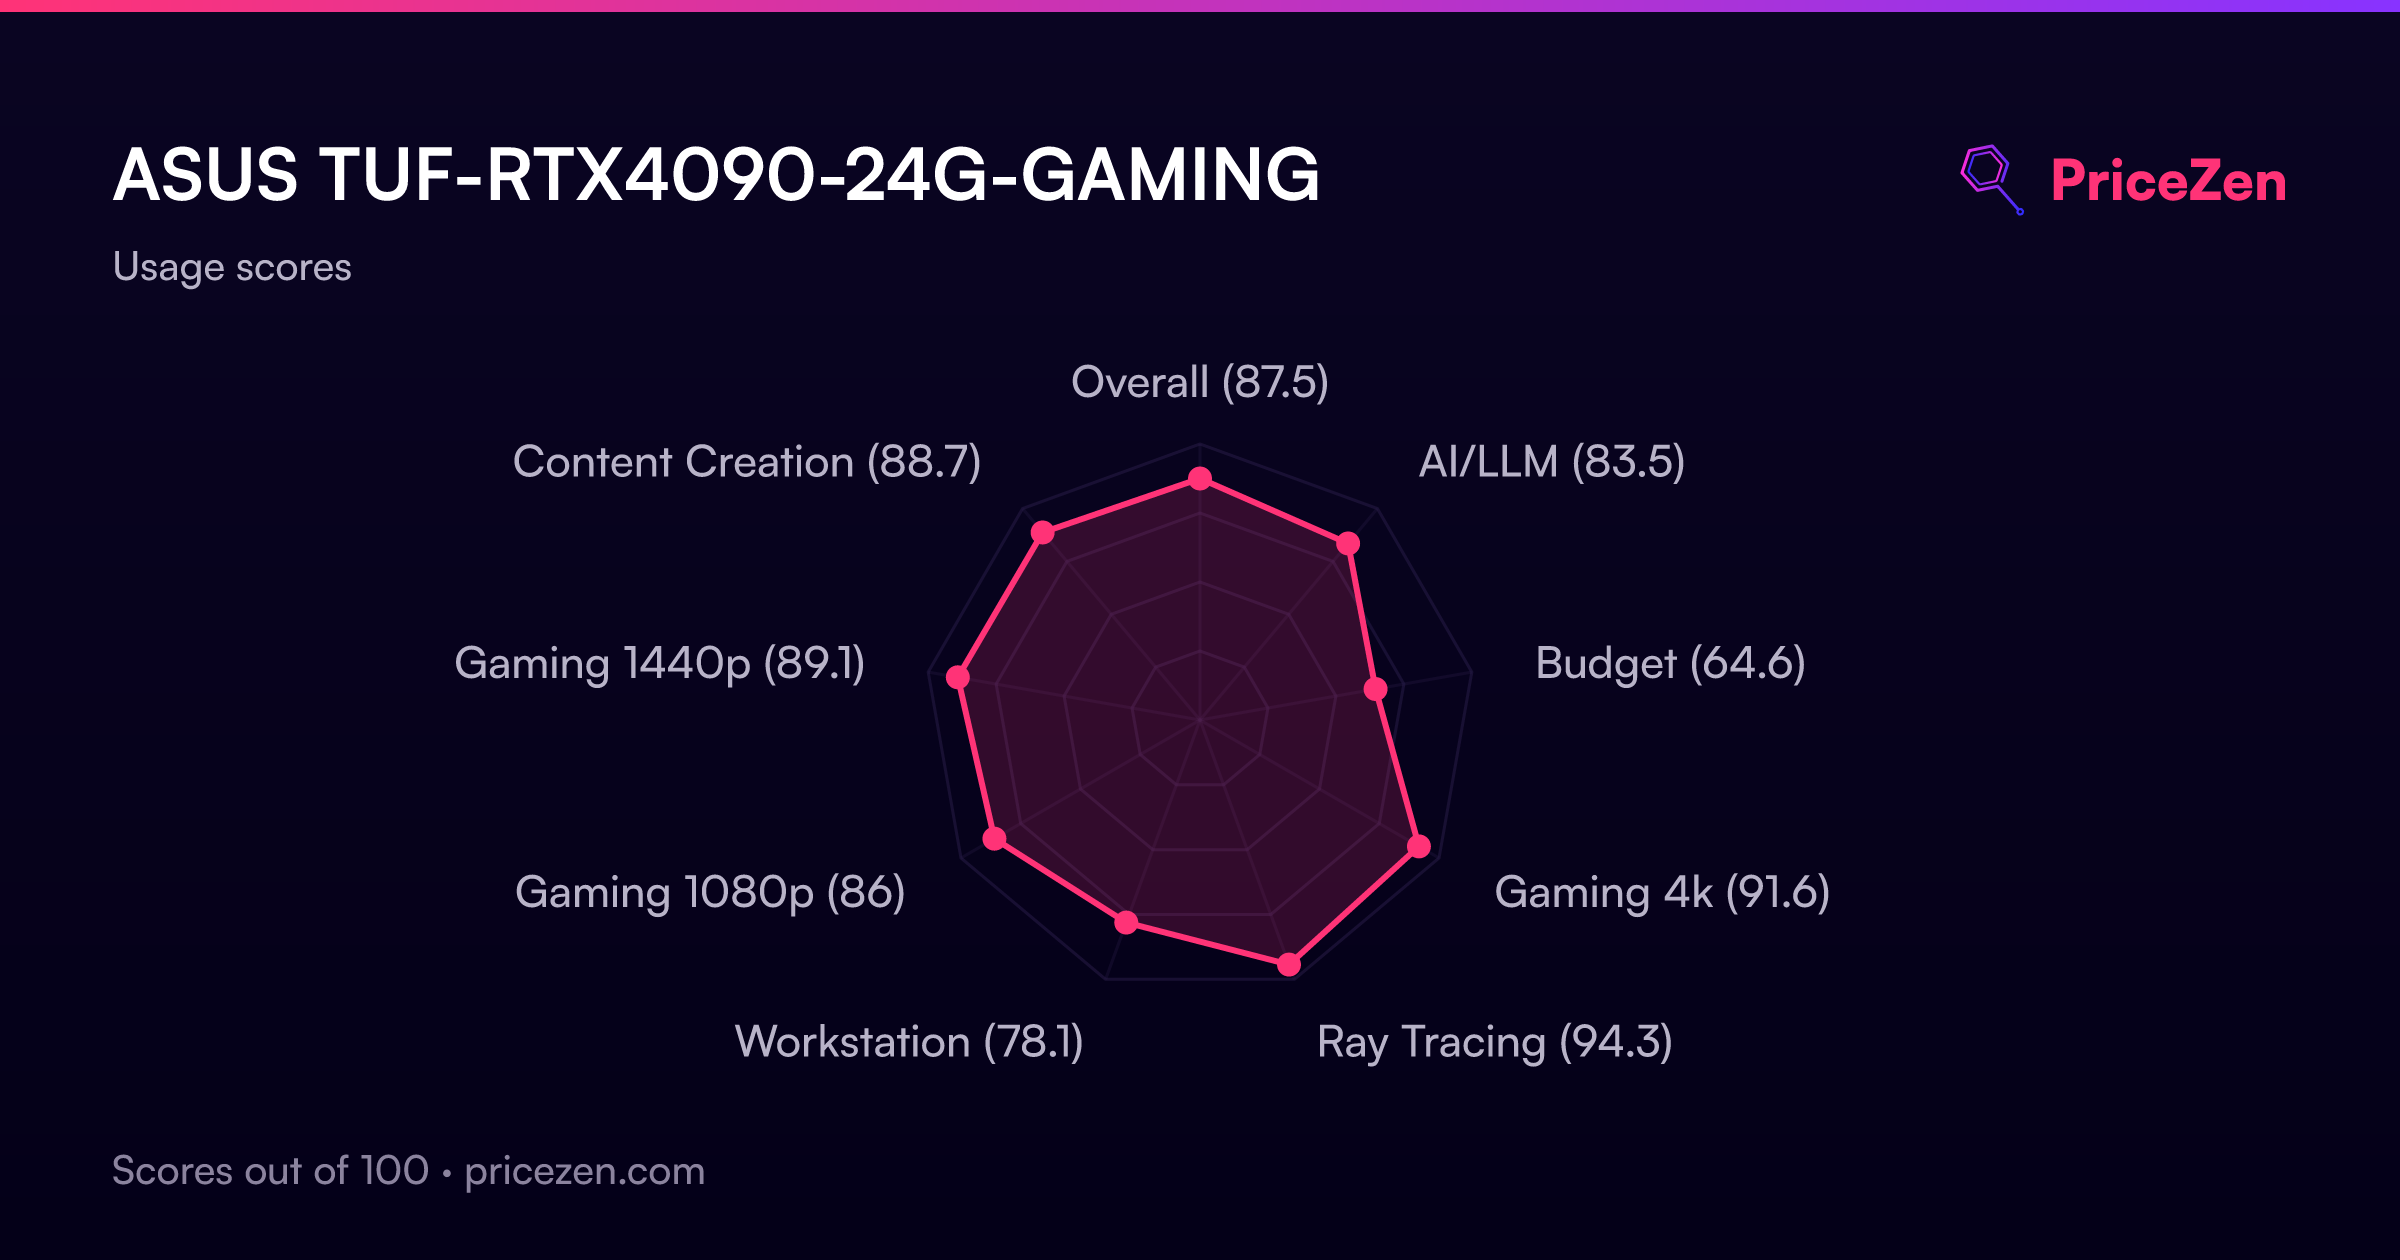
Usage Scores
- Overall87.5
- AI/LLM83.5
- Budget64.6
- Gaming 4k91.6
- Ray Tracing94.3
- Workstation78.1
- Gaming 1080p86
- Gaming 1440p89.1
- Content Creation88.7
A full written review is coming soon. The specs, scores, prices and charts above are always up to date.