Dell Quadro P1000 4GB GDDR5 workstation
Driving four displays via mini DisplayPort 1.4 at a low 47W TDP, this card’s 4GB GDDR5 and Quadro P1000 chipset provide certified reliability for multi-monitor productivity without external power. Its compact single-slot design and support for NVIDIA Mosaic and nView desktop management make it a practical fit for dense, multi-screen financial or control-room deployments. This card is best for entry-level CAD users and office professionals who need stable, ISV-certified drivers for 2D design and up to four 4K displays.

現在、販売店の最新価格はありません
概要
メリットとデメリット
長所
- Strong affordability (94th percentile) 94th
短所
- Below average thermal (7th percentile)
- Below average ai (10th percentile)
- Below average feature (11th percentile)
- Below average vram (11th percentile)
オーナーの声
購入者の評価が時間とともにどう変化したか
独自顧客が実際にレビューを書いた時期に基づいています。発売当初の高評価が続いたかどうかがわかります。
書かれたレビュー 4件、2024/01~2026/01:満足 3件、不満 1件
ストア評価全8件:4.1★。 多くの購入者はレビューを書かずに評価だけを付けています。 グラフは書かれたレビュー4件を数えています。
各点は書かれたレビュー1件で、書かれた月に置いています。満足 = 4〜5★、普通 = 3★、不満 = 1〜2★。
実証データ
パフォーマンス
スペック
全スペック一覧
Chipset
| GPU Chipset | Quadro P1000 |
| Brand | NVIDIA |
| Class | workstation |
Memory
| VRAM | 4 GB |
| Memory Type | GDDR5 |
Compute
| Base Clock | 1354 |
Performance
| PassMark G3D | 4493 |
| GPU Compute | 1887 |
Power & Cooling
| TDP | 47 |
Connectivity
| Interface | PCI Express 3.0 x16 |
| DisplayPort | 4 |
Physical
| Length | 305 |
| Form Factor | Full Height |
| Weight | 0.4 kg / 0.9 lbs |
競合製品との比較
| Spec | Dell Quadro P1000 | ASUS GeForce RTX 5090 TUF Gaming | Gigabyte GeForce RTX 5070 Ti Eagle Ice | MSI GeForce RTX 5070 Ti Ventus 3X OC | ZOTAC GeForce RTX 5080 APOCALYPSE | Sapphire Radeon RX 7900 XTX NITRO+ |
|---|---|---|---|---|---|---|
| Chipset | Quadro P1000 | GeForce RTX 5090 | GeForce RTX 5070 Ti | GeForce RTX 5070 Ti | GeForce RTX 5080 | Radeon RX 7900 XTX |
| Vram | 4GB GDDR5 | 32GB GDDR7 | 16GB GDDR7 | 16GB GDDR7 | 16GB GDDR7 | 24GB GDDR6 |
| Boost Clock Mhz | - | 2407 | 2542 | 2482 | 2730 | 2680 |
| Tdp W | 47 | 575 | 300 | 300 | 360 | 339 |
| Memory Bus Bits | - | 512 | 256 | 256 | 256 | 384 |
| Ray Tracing | - | true | true | true | true | true |
| GPU Class | workstation | consumer | consumer | consumer | consumer | consumer |
| Compare | Compare | Compare | Compare | Compare |
| 製品 | AI | Rt | Vram | Raster | Feature | Thermal | Efficiency | Connectivity | ユーザー評価 | Affordability |
|---|---|---|---|---|---|---|---|---|---|---|
| Dell Quadro P1000 | 10.2 | 14.8 | 11.2 | 14.9 | 10.9 | 6.5 | 53.7 | 36.3 | 13.4 | 94 |
| ASUS GeForce RTX 5090 TUF Gaming Compare | 97.1 | 90.5 | 97.8 | 98.8 | 95.9 | 72.4 | 24.1 | 99.3 | 98.7 | 2.3 |
| Gigabyte GeForce RTX 5070 Ti Eagle Ice Compare | 79.5 | 88.7 | 86 | 89 | 95.9 | 91.7 | 72.1 | 94.1 | 93.3 | 26.7 |
| MSI GeForce RTX 5070 Ti Ventus 3X OC Compare | 79.5 | 92.5 | 86 | 89 | 95.9 | 91.7 | 72.1 | 94.1 | 83.8 | 23.1 |
| ZOTAC GeForce RTX 5080 APOCALYPSE Compare | 85.6 | 97.6 | 89.1 | 94.5 | 95.9 | 91.7 | 57.1 | 94.1 | 98.7 | 20.3 |
| Sapphire Radeon RX 7900 XTX NITRO+ Compare | 95.1 | 96.2 | 91.9 | 83.5 | 95.9 | 91.7 | 52 | 98.8 | 68.9 | 18.6 |
用途別スコア
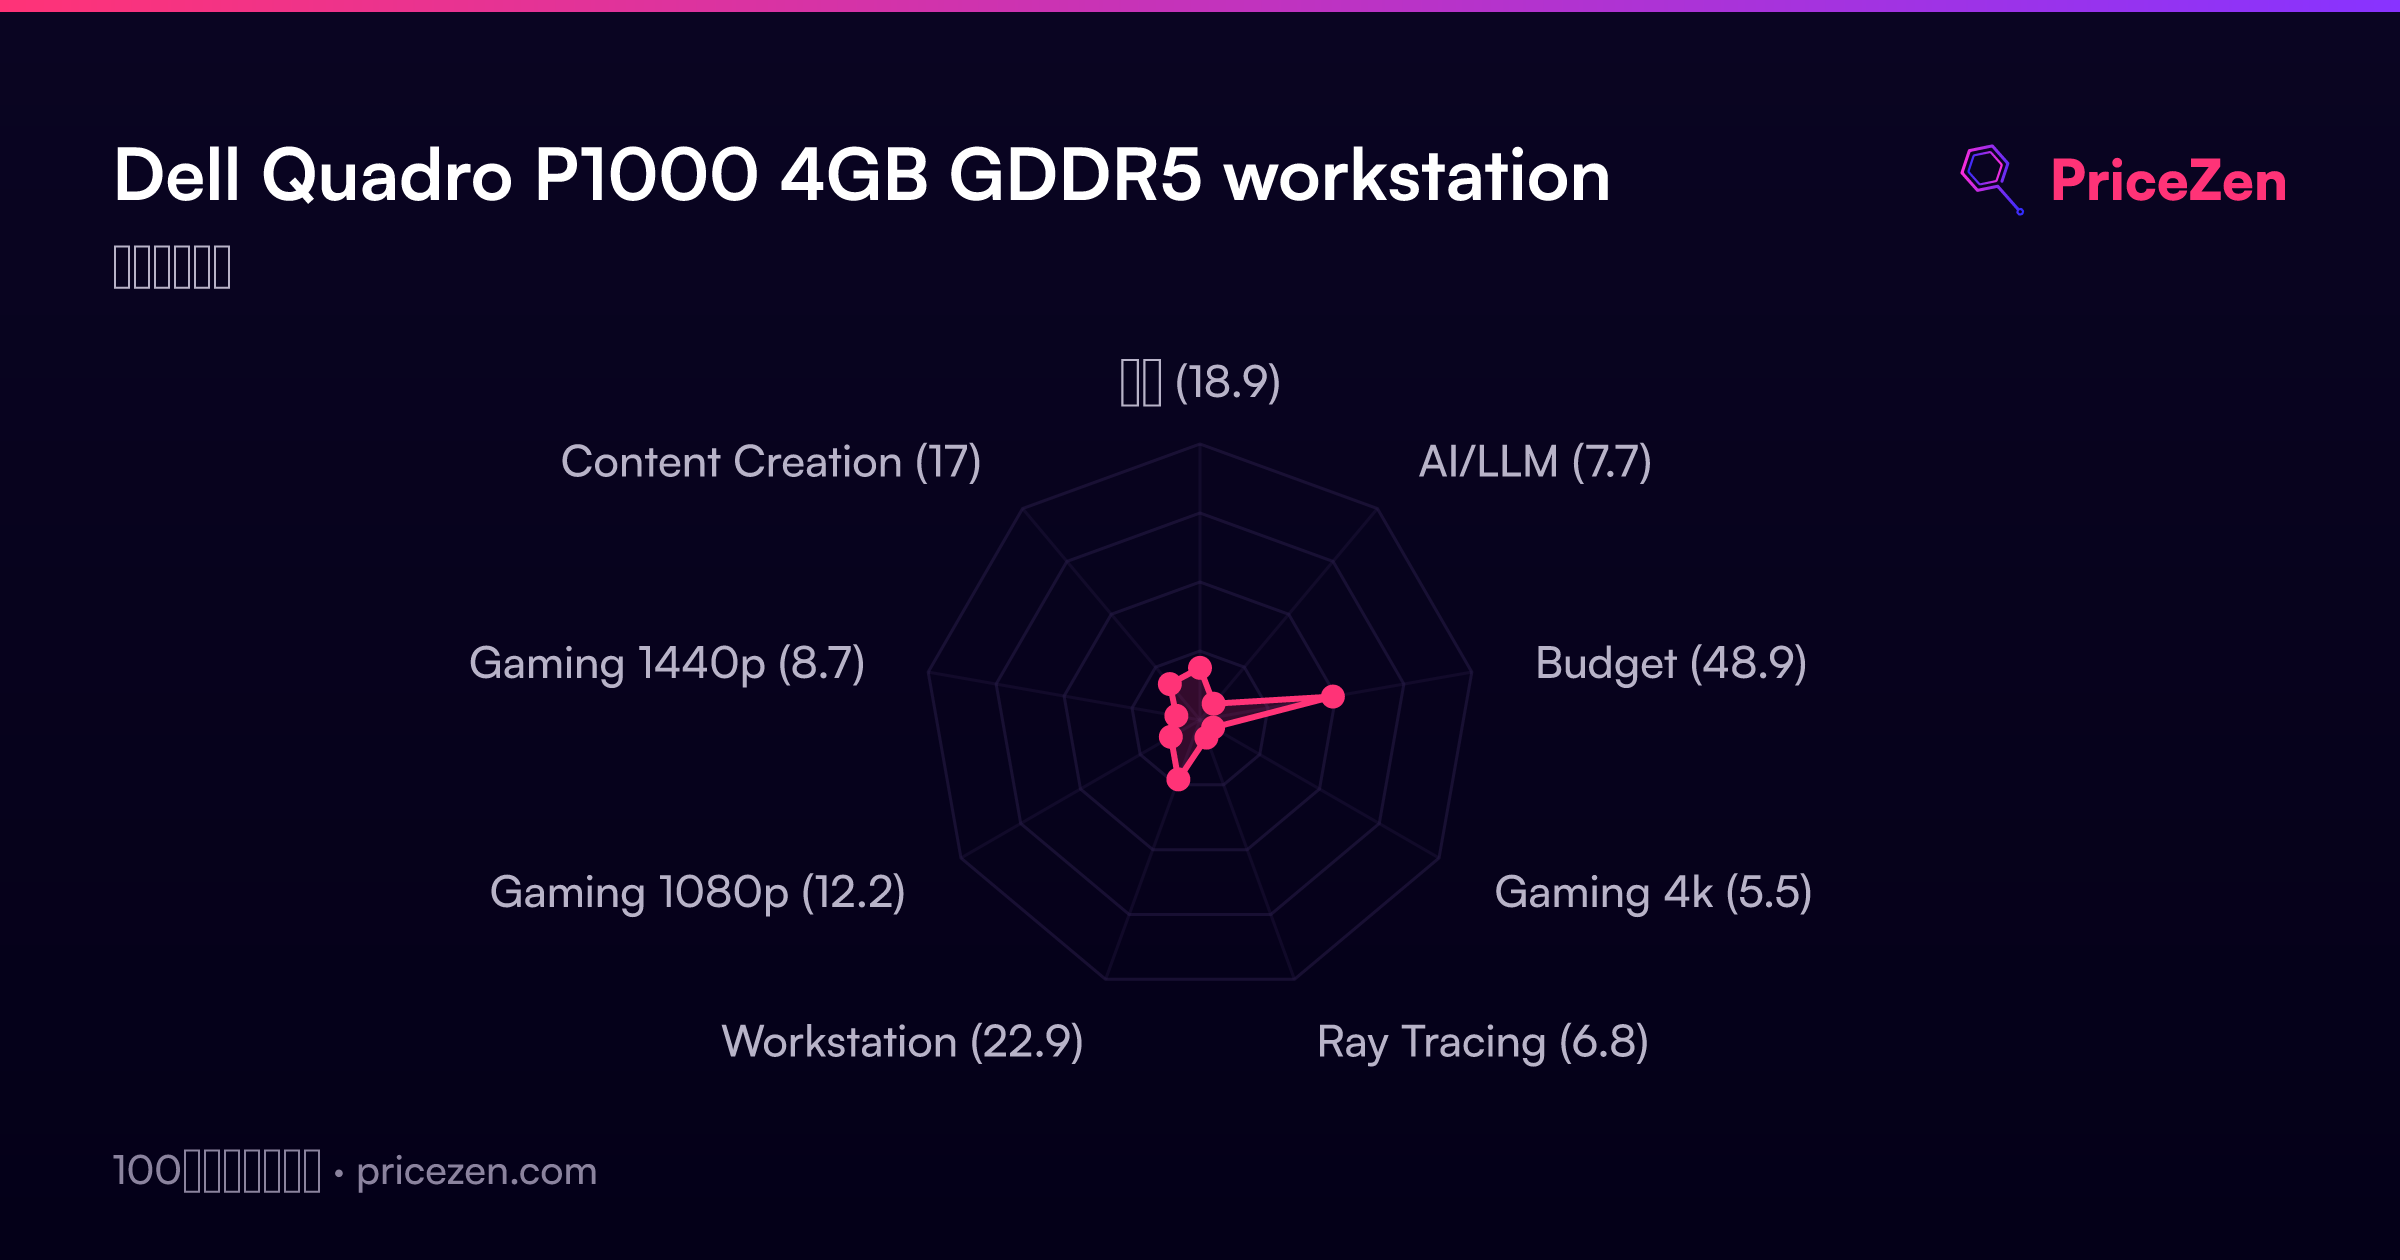
- 総合18.9
- AI/LLM7.7
- Budget48.9
- Gaming 4k5.5
- Ray Tracing6.8
- Workstation22.9
- Gaming 1080p12.2
- Gaming 1440p8.7
- Content Creation17
詳細なレビューは近日公開予定です。上記のスペック、スコア、価格、チャートは常に最新です。