新着
Dell Tower Plus 2250 2025, Core Ultra 9 285, 32GB, 2TB SSD, RTX 4060 Ti, Graphite
CPU Intel Core Ultra 9 285
RAM 32 GB
Storage 2 TB
GPU NVIDIA GeForce RTX 4060 Ti
Form Factor mid-tower
OS Windows 11 Pro

72 総合スコア
現在、販売店の最新価格はありません


概要
メリットとデメリット
長所
- Strong cpu (94th percentile) 94th
- Strong storage (90th percentile) 90th
- Strong gpu (86th percentile) 86th
- Strong ram (72nd percentile) 72nd
短所
- Below average port selection (13th percentile)
実証データ
パフォーマンス
スペック
全スペック一覧
Processor
| CPU | Intel Core Ultra 9 285 |
| Cores | 24 |
| Frequency | 1.9 GHz |
| L3 Cache | 36 MB |
Graphics
| GPU | NVIDIA GeForce RTX 4060 Ti |
| Type | Discrete |
| VRAM | 8 GB |
| VRAM Type | GDDR6 |
Memory & Storage
| RAM | 32 GB |
| RAM Generation | DDR5 |
| Storage | 2 TB |
| Storage Type | NVMe SSD |
Build
| Form Factor | mid-tower |
Connectivity
| Wi-Fi | Wi-Fi 7 |
| Bluetooth | ✓ |
System
| OS | Windows 11 Pro |
競合製品との比較
| Spec | Dell Tower Plus 2250 | Apple Mac Studio M5 Max | Lenovo T Series Towers Legion Tower 5a Gen 10 | HP OMEN GT16-0364 | ASUS ROG GM700 | CLX SET TGMSETRTU5204BM |
|---|---|---|---|---|---|---|
| CPU | Intel Core Ultra 9 285 | Apple M5 Max | AMD Ryzen 7 7800X3D | AMD Ryzen 7 8700F | AMD Ryzen 7 9800X3D | Intel Core i9 14900KF |
| RAM (GB) | 32 | 36 | 32 | 32 | 32 | 64 |
| Storage (GB) | 2048 | 1024 | 4096 | 1024 | 2048 | 8192 |
| GPU | NVIDIA GeForce RTX 4060 Ti | Apple (32-Core) | NVIDIA GeForce RTX 5070 Ti | NVIDIA GeForce RTX 5070 | NVIDIA GeForce RTX 5070 Ti | NVIDIA GeForce RTX 5070 |
| Form Factor | mid-tower | mini | mid-tower | mid-tower | mid-tower | mid-tower |
| Psu W | - | 480 | 850 | 850 | 850 | 850 |
| OS | Windows 11 Pro | macOS | Windows 11 Home | Windows 11 Home | Windows 11 Home | Windows 11 Home |
| Compare | Compare | Compare | Compare | Compare |
| 製品 | CPU | GPU | RAM | ポート | ストレージ | 信頼性 |
|---|---|---|---|---|---|---|
| Dell Tower Plus 2250 | 94 | 85.5 | 72.3 | 12.8 | 90.1 | 69.9 |
| Apple Mac Studio M5 Max Compare | 95.8 | 85.2 | 92.4 | 88.9 | 68.9 | 99.3 |
| Lenovo T Series Towers Legion Tower 5a Gen 10 Compare | 73.4 | 94.7 | 78 | 88.3 | 98.1 | 69.9 |
| HP OMEN GT16-0364 Compare | 69.6 | 90.8 | 87.1 | 97.8 | 53.6 | 69.9 |
| ASUS ROG GM700 Compare | 80.6 | 94.7 | 81.7 | 96 | 90.1 | 37.1 |
| CLX SET TGMSETRTU5204BM Compare | 94.9 | 90.8 | 96.5 | 84.1 | 99.1 | 11.5 |
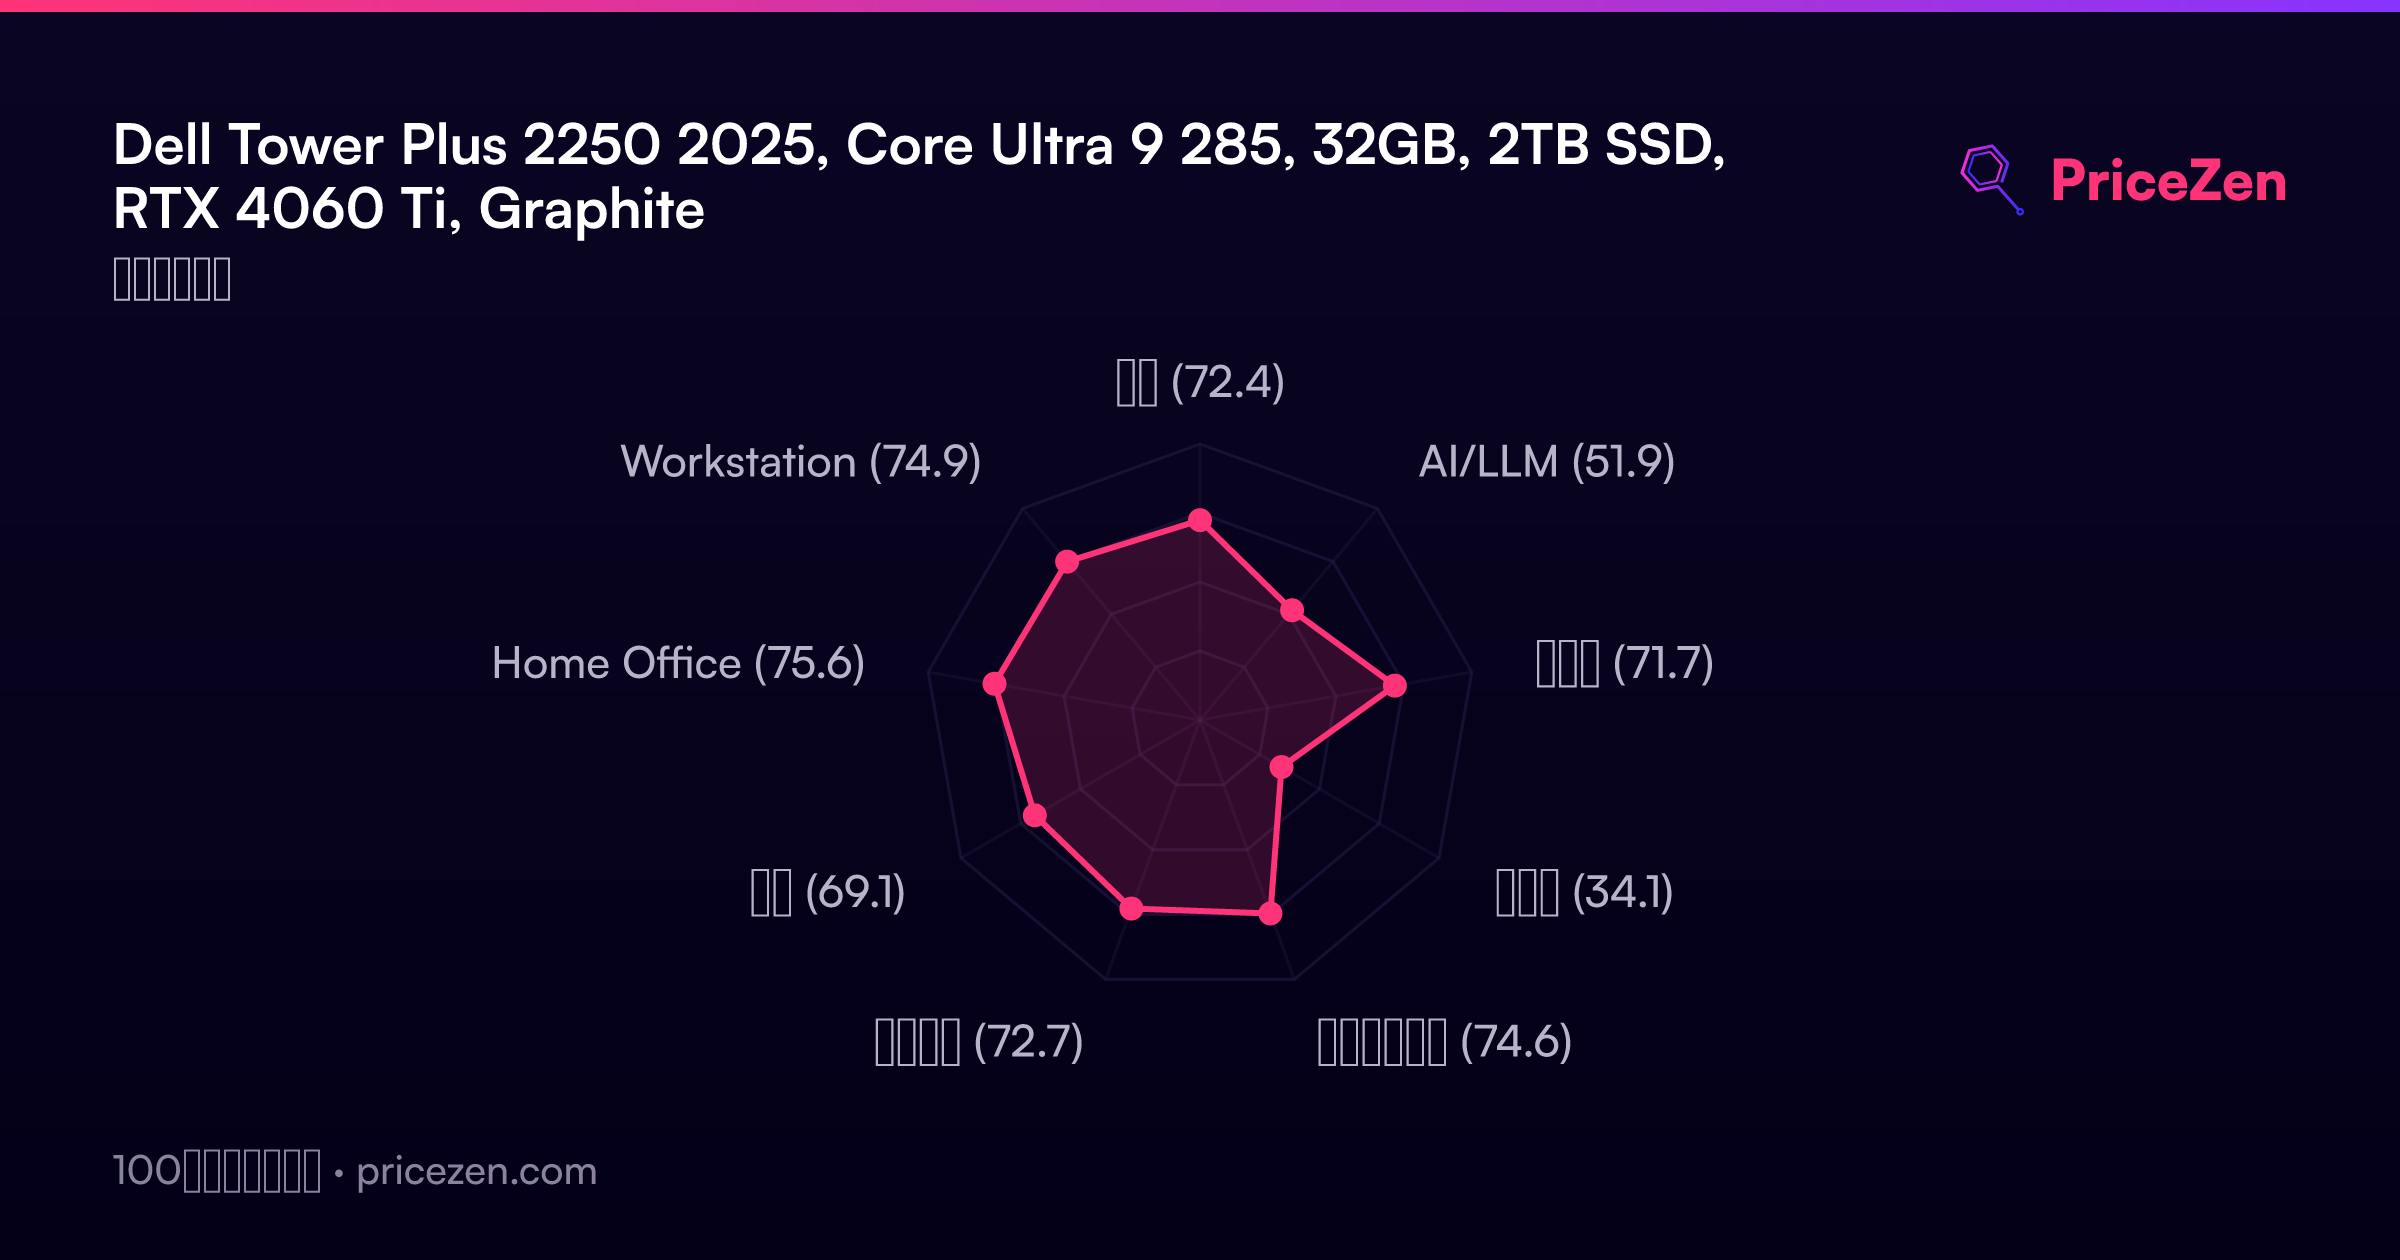
用途別スコア
- 総合72.4
- AI/LLM51.9
- ゲーム71.7
- 携帯性34.1
- クリエイター74.6
- ビジネス72.7
- 開発69.1
- Home Office75.6
- Workstation74.9
詳細なレビューは近日公開予定です。上記のスペック、スコア、価格、チャートは常に最新です。