Dell OptiPlex 7040 2015, Core i7-6700, 4GB, 128GB SSD, Black
CPU Intel Core i7-6700
RAM 4 GB
Storage 128 GB
GPU Intel HD Graphics 530
Form Factor sff
OS Windows 10 Pro

28 Overall Score
No current retailer price
Snapshot
Pros & Cons
Pros
- Strong reliability (70th percentile) 70th
Cons
- Below average ram (1st percentile)
- Below average storage (6th percentile)
- Below average port selection (13th percentile)
- Below average gpu (22nd percentile)
The proof
Performance
Specifications
Full Specifications
Processor
| CPU | Intel Core i7-6700 |
| Cores | 4 |
| Frequency | 3.4 GHz |
| L3 Cache | 8 MB |
Graphics
| GPU | Intel HD Graphics 530 |
| Type | Integrated |
Memory & Storage
| RAM | 4 GB |
| RAM Generation | DDR3 |
| Storage | 128 GB |
| Storage Type | SSD |
Build
| Form Factor | sff |
| Weight | 4.9 kg / 10.7 lbs |
Connectivity
| Ethernet | Gigabit Ethernet |
System
| OS | Windows 10 Pro |
vs Competition
| Spec | Dell OptiPlex 7040 | Apple Mac Studio M5 Max | Lenovo T Series Towers Legion Tower 5a Gen 10 | HP OMEN GT16-0364 | ASUS ROG GM700 | MSI Aegis ZS2 A9NVP-1407US |
|---|---|---|---|---|---|---|
| CPU | Intel Core i7-6700 | Apple M5 Max | AMD Ryzen 7 7800X3D | AMD Ryzen 7 8700F | AMD Ryzen 7 9800X3D | AMD Ryzen 9 9900X |
| RAM (GB) | 4 | 36 | 32 | 32 | 32 | 32 |
| Storage (GB) | 128 | 1024 | 4096 | 1024 | 2048 | 2048 |
| GPU | Intel HD Graphics 530 | Apple (32-Core) | NVIDIA GeForce RTX 5070 Ti | NVIDIA GeForce RTX 5070 | NVIDIA GeForce RTX 5070 Ti | NVIDIA GeForce RTX 5070 |
| Form Factor | sff | mini | mid-tower | mid-tower | mid-tower | mid-tower |
| Psu W | - | 480 | 850 | 850 | 850 | 750 |
| OS | Windows 10 Pro | macOS | Windows 11 Home | Windows 11 Home | Windows 11 Home | Windows 11 Home |
| Compare | Compare | Compare | Compare | Compare |
| Product | CPU | GPU | RAM | Ports | Storage | Reliability |
|---|---|---|---|---|---|---|
| Dell OptiPlex 7040 | 24.9 | 21.9 | 1 | 12.7 | 5.7 | 70 |
| Apple Mac Studio M5 Max Compare | 95.7 | 85.2 | 92.4 | 89 | 68.8 | 99.3 |
| Lenovo T Series Towers Legion Tower 5a Gen 10 Compare | 73.4 | 94.7 | 77.9 | 88.3 | 98.1 | 70 |
| HP OMEN GT16-0364 Compare | 69.5 | 90.8 | 87.1 | 97.9 | 53.5 | 70 |
| ASUS ROG GM700 Compare | 80.5 | 94.7 | 81.6 | 96 | 90 | 37.3 |
| MSI Aegis ZS2 A9NVP-1407US Compare | 92.4 | 90.8 | 87.1 | 90.4 | 82.7 | 37.3 |
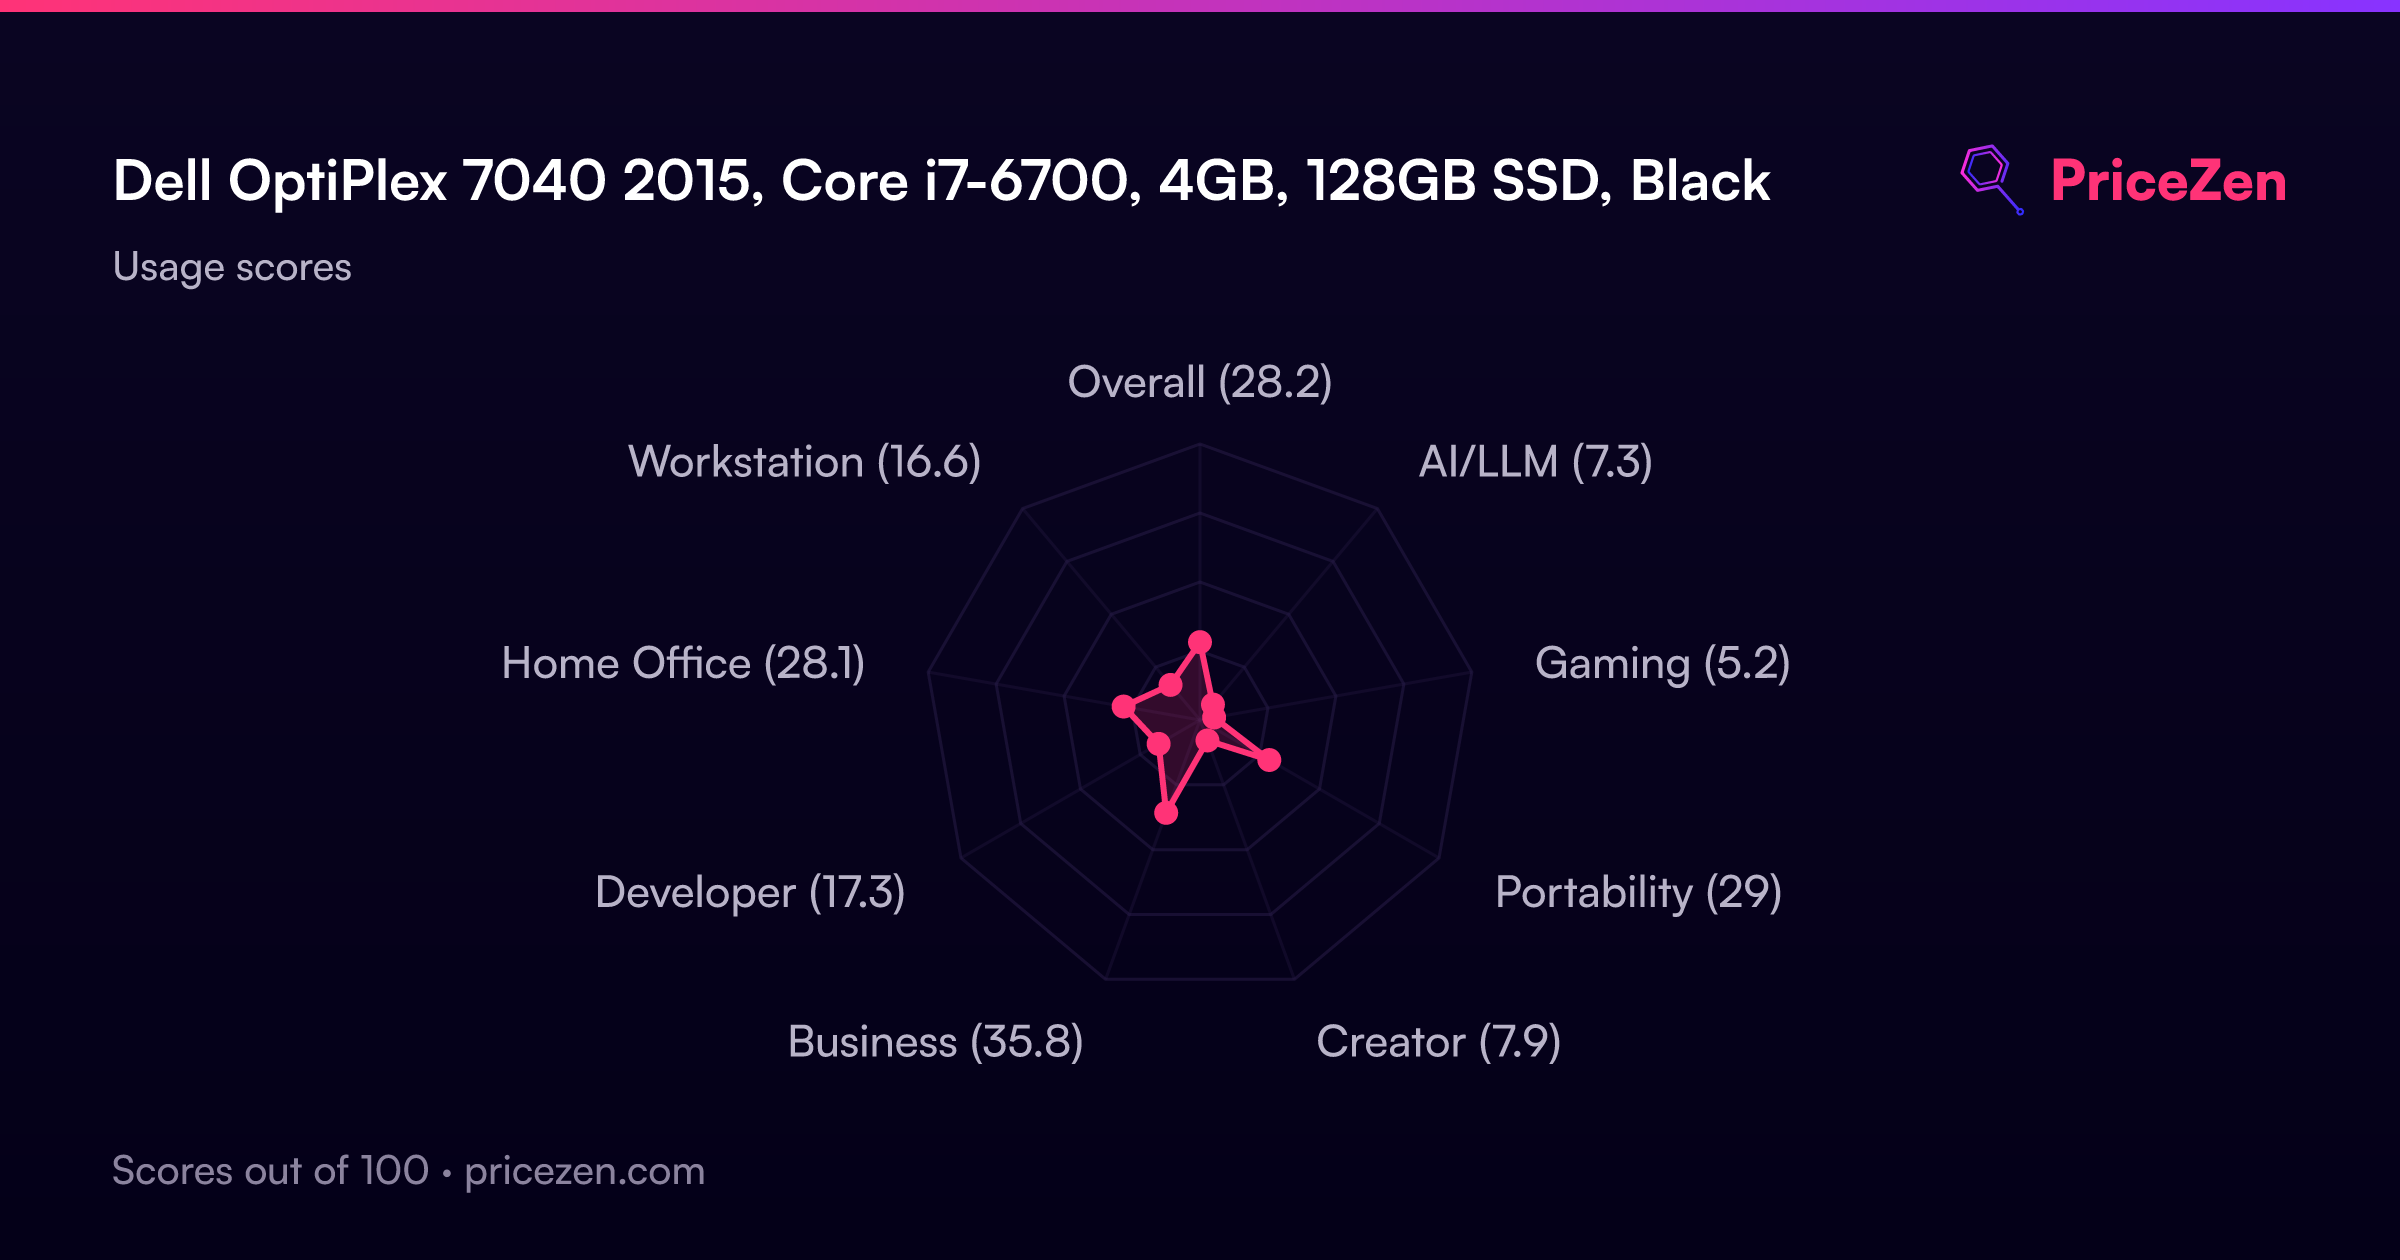
Usage Scores
- Overall28.2
- AI/LLM7.3
- Gaming5.2
- Portability29
- Creator7.9
- Business35.8
- Developer17.3
- Home Office28.1
- Workstation16.6
A full written review is coming soon. The specs, scores, prices and charts above are always up to date.
Other Configurations57
OptiPlex 7040Intel Core i7-670016GB256GBBlackOptiPlex 7040Intel Core i7-670032GB1536GBBlackOptiPlex 7040Intel Core i5-650016GB500GBBlackOptiPlex 7040 SFFIntel Core i7-670016GB256GBBlackOptiPlex 7040Intel Core i7-67008GB628GBOptiplex 7040 SFFIntel Core i7-67008GB128GBBlackOptiPlex 7040 SFFIntel Core i5 650032GB1TBBlackOptiPlex 7040 SFFIntel Core i5 650016GB2304GBBlackOptiPlex 7040Intel Core i5-650016GB4TBBlack
Show all 57 configurations
Optiplex 7040 SFFIntel Core i5 650016GB256GBBlackOptiPlex 7040Intel Core i5 650016GB1012GBBlackOptiPlex 7040Intel Core i5-65008GB756GBBlackOptiPlex 7040 SFF65008GB128GBBlackOptiPlex 7040-SFFIntel Core i7 670016GB512GBBlackOptiplex 7040 SFFIntel Core i5 650016GB480GBOptiPlex 7040Intel Core i7-670016GB1TBBlackOptiPlex 7040Intel Core i7-670064GB1TBBlackOptiPlex 7040 SFFIntel Core i7 670032GB3TBBlackOptiPlex 7040 SFFIntel Core i7 6700512GB2560GBBlackOptiPlex 7040Intel Core i7-670016GB500GBBlackOptiPlex 7040Intel Core i7-670016GB512GBBlackOptiPlex 7040 SFFIntel Core i5-650016GB256GBOptiPlex 7040 SFFIntel Core i5 650016GB240GBBlackOptiPlex 7040 SFFIntel Core i5 65008GB240GBBlackOptiplex 7040 Small FormIntel Core i7 670064GB1TBOptiPlex 7040Intel Core i5-65008GB2TBBlackOptiPlex 7040Intel Core i5 65008GB1TBBlackOptiplex 7040Intel Core i5 65008GB512GBBlackOptiPlex 7040Intel Core i5-660016GB512GBBlackOptiPlex 7040Intel Core i5-66008GB256GBBlackOptiPlex 7040-SFFIntel Core i7-67008GB256GBBlackOptiPlex 7040-SFFi5-65008GB480GBBlack/SilverOptiplex 7040Intel Core i5 650032GB1TBOptiPlex 7040Intel Core i7 67008GB1TBBlackOptiPlex 7040Intel Core i5-6500T8GB250GBBlackOptiplex 7040Intel Core i5-66008GB500GBBlackOptiPlex 7040-SFFi7-670016GB480GBBlack/SilverOptiPlex 7040-SFFi5-65008GB512GBOptiPlex 7040 SFFIntel Core i5 6th Gen16GB2560GBOptiPlex 7040 SFFIntel Core i7-670016GB3TBBlackOptiPlex 7040Intel Core i7 670032GB1TBBlackOptiPlex 7040Intel Core i5-650016GB256GBBlackOptiPlex 7040Intel Core i5 65008GB360GBBlackOptiPlex 7040Intel Core i5 650016GB2TBBlackOptiPlex 7040Intel Core i7-670012GB240GBBlackOptiPlex 7040Intel Core i5 6th Gen8GB256GBBlackOptiPlex 7040 SFF BusinessIntel Core i5-650016GB480GBBlackOptiPlex 7040 SFF Core i5Intel Core i5 65008GB240GBBlackOptiPlex 7040Intel Core i7-670024GB128GBBlackOptiPlex 7040Intel Core i5-650024GB240GBBlackOptiPlex 7040Intel Core i5 65008GB128GBBlackOptiPlex 7040Intel Core i5 65004GB500GBBlackOptiPlex 7040Intel Core i5 6th Gen8GB512GBBlackOptiplex 7040 SFF Desktop TowerIntel Core i7-67008GB512GBBlackOptiPlex 7040Intel Core i5-650012GB128GBBlackOptiPlex 7040Intel Core i7 67008GB256GBBlackOptiPlex 7040 SFFIntel Core i5 64008GB1TBBlack