नया
MSI Codex R2 2026, Core i5-14400F, 64GB, 2TB SSD, RTX 5050, Black
CPU Intel Core i5 14400F
RAM 64 GB
Storage 2 TB
GPU NVIDIA GeForce RTX 5050
Form Factor mid-tower
psu w 650
OS Windows 11 Pro

72 ओवरऑल स्कोर
अभी किसी विक्रेता की मौजूदा कीमत नहीं है
एक नज़र में
फायदे और नुकसान
खूबियाँ
- Strong ram (94th percentile) 94th
- Strong storage (90th percentile) 90th
- Strong gpu (74th percentile) 74th
- Strong port selection (69th percentile) 69th
कमियाँ
प्रमाण
प्रदर्शन
तकनीकी विशेषताएं
पूर्ण विनिर्देश
Processor
| CPU | Intel Core i5 14400F |
| Cores | 10 |
| Frequency | 2.5 GHz |
| L3 Cache | 20 MB |
Graphics
| GPU | NVIDIA GeForce RTX 5050 |
| Type | Discrete |
| VRAM | 8 GB |
| VRAM Type | GDDR7 |
Memory & Storage
| RAM | 64 GB |
| RAM Generation | DDR5 |
| Storage | 2 TB |
| Storage Type | NVMe SSD |
Build
| Form Factor | mid-tower |
| PSU | 650 |
| Weight | 9.0 kg / 19.8 lbs |
Connectivity
| USB-C Ports | 1 |
| USB Ports | 6 |
| HDMI | 1x HDMI 2.1 |
| DisplayPort | 3x DisplayPort |
| Wi-Fi | Wi-Fi 6E |
| Bluetooth | Bluetooth 5.3 |
| Ethernet | RJ-45 |
System
| OS | Windows 11 Pro |
प्रतिस्पर्धियों से तुलना
| Spec | MSI Codex R2 | Apple Mac Studio M5 Max | Lenovo T Series Towers Legion Tower 5a Gen 10 | Dell Desktop ECT1250 | HP OMEN GT16-0364 | ASUS ROG GM700 |
|---|---|---|---|---|---|---|
| CPU | Intel Core i5 14400F | Apple M5 Max | AMD Ryzen 7 7800X3D | Intel Core Ultra 7 265 | AMD Ryzen 7 8700F | AMD Ryzen 7 9800X3D |
| RAM (GB) | 64 | 36 | 32 | 32 | 32 | 32 |
| Storage (GB) | 2048 | 1024 | 4096 | 2048 | 1024 | 2048 |
| GPU | NVIDIA GeForce RTX 5050 | Apple (32-Core) | NVIDIA GeForce RTX 5070 Ti | Intel UHD Graphics | NVIDIA GeForce RTX 5070 | NVIDIA GeForce RTX 5070 Ti |
| Form Factor | mid-tower | mini | mid-tower | sff | mid-tower | mid-tower |
| Psu W | 650 | 480 | 850 | 180 | 850 | 850 |
| OS | Windows 11 Pro | macOS | Windows 11 Home | Windows 11 Home | Windows 11 Home | Windows 11 Home |
| Compare | Compare | Compare | Compare | Compare |
| उत्पाद | CPU | GPU | RAM | पोर्ट | स्टोरेज | विश्वसनीयता |
|---|---|---|---|---|---|---|
| MSI Codex R2 | 61.4 | 74.2 | 93.8 | 68.7 | 90 | 37.3 |
| Apple Mac Studio M5 Max Compare | 95.7 | 85.1 | 92.4 | 88.9 | 68.8 | 99.3 |
| Lenovo T Series Towers Legion Tower 5a Gen 10 Compare | 73.4 | 94.6 | 77.9 | 88.3 | 98.1 | 70 |
| Dell Desktop ECT1250 Compare | 88.2 | 60.2 | 81.6 | 74.5 | 82.7 | 70 |
| HP OMEN GT16-0364 Compare | 69.5 | 90.8 | 87 | 97.9 | 53.4 | 70 |
| ASUS ROG GM700 Compare | 80.5 | 94.6 | 81.6 | 96 | 90 | 37.3 |
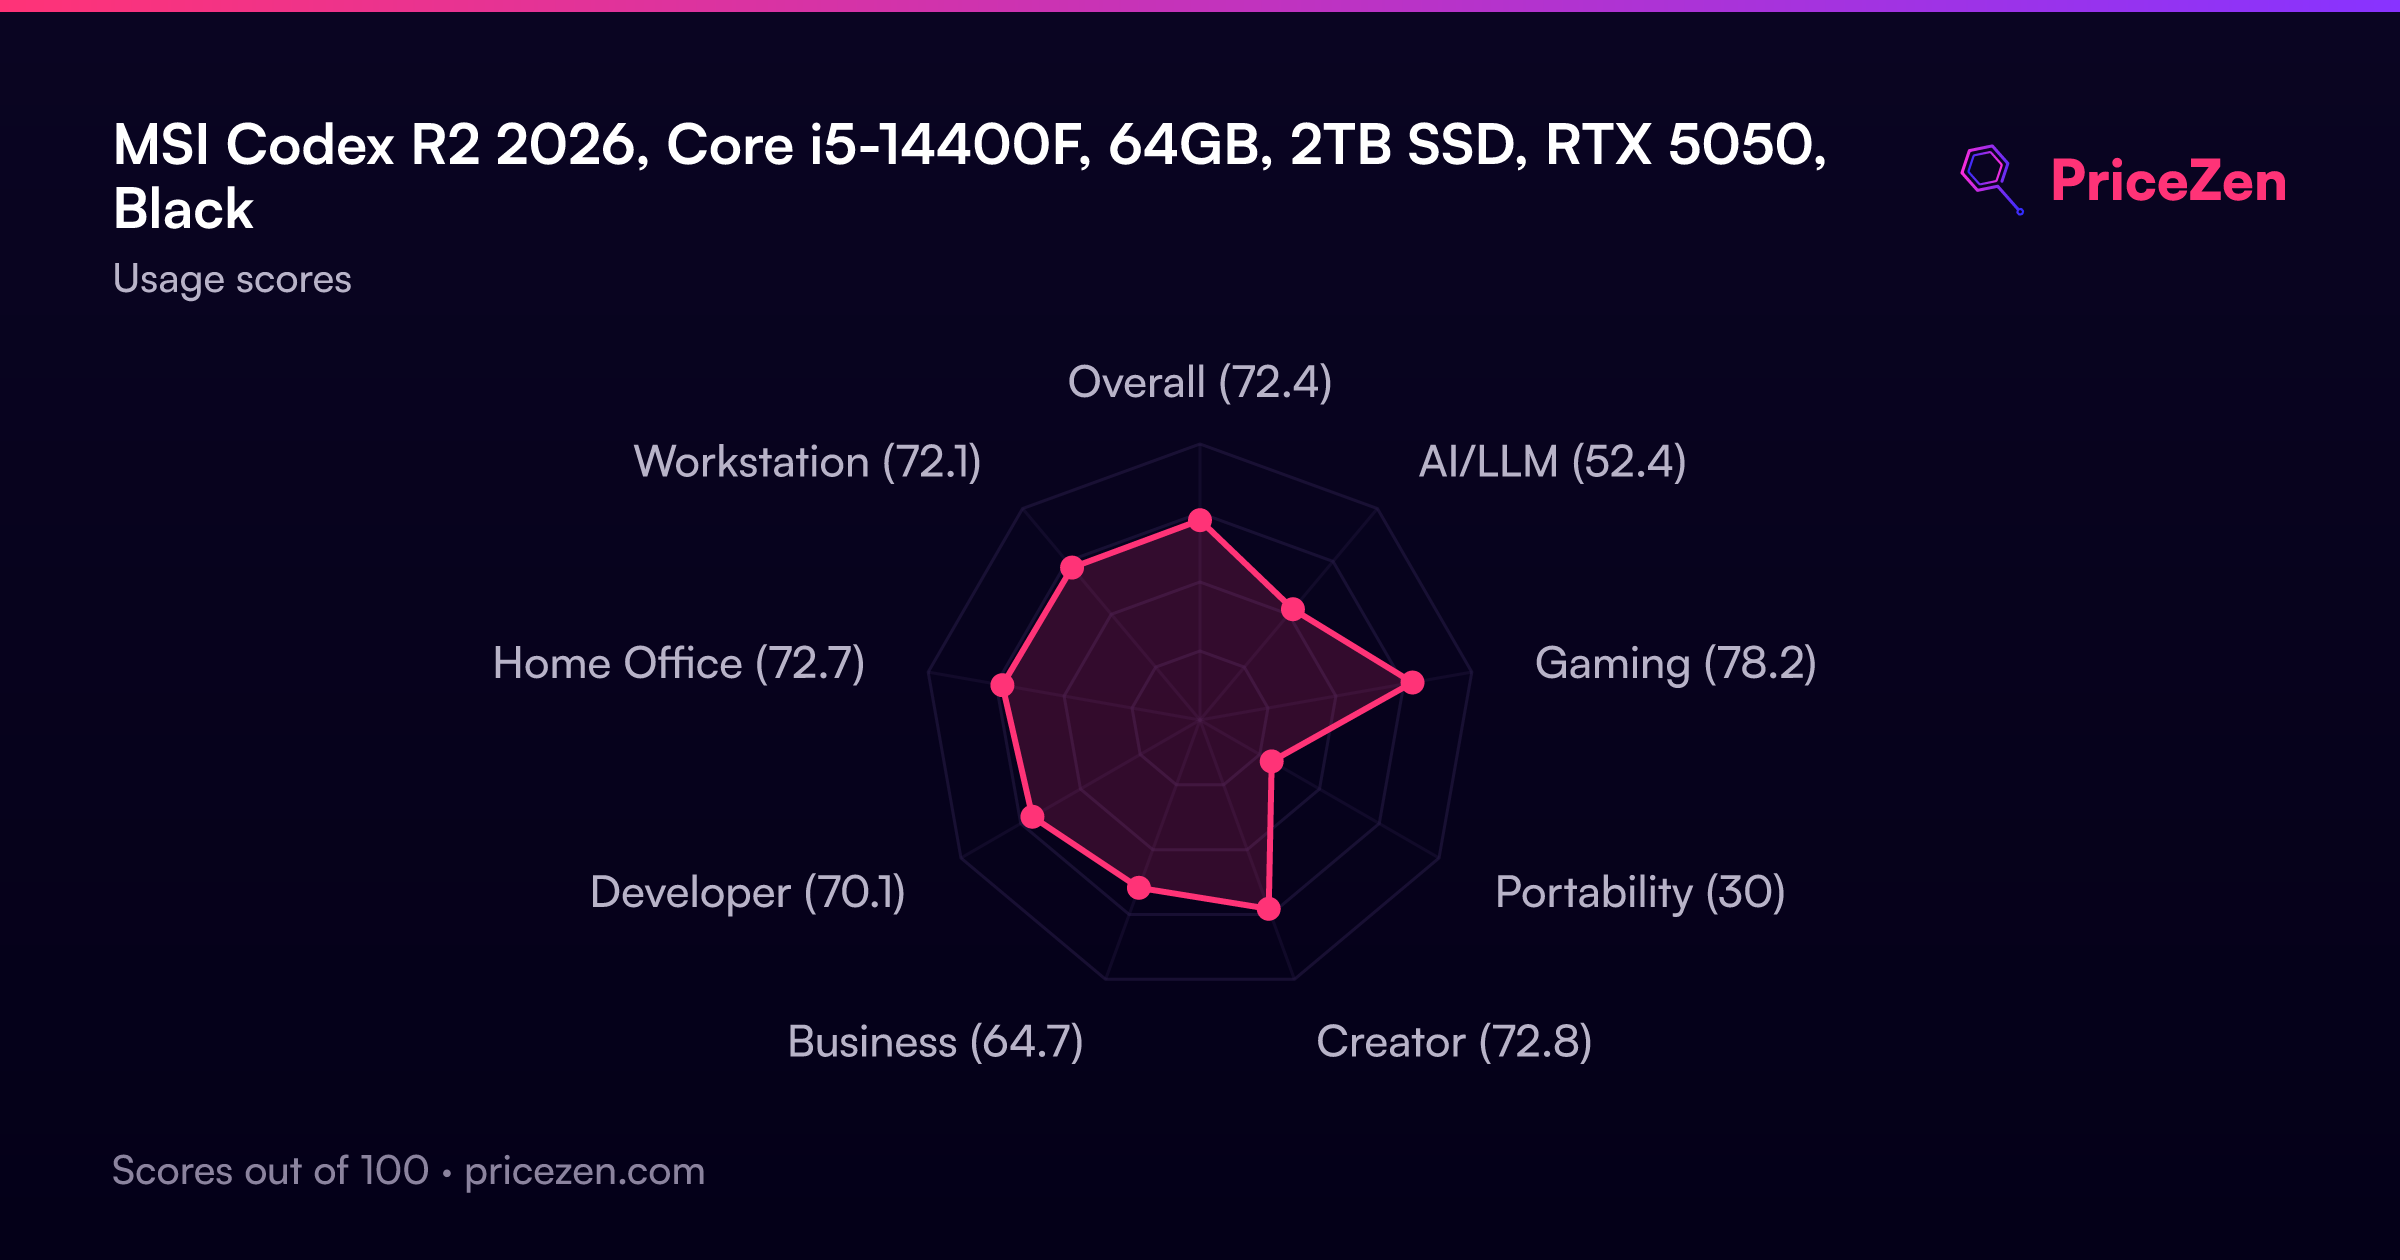
उपयोग के अनुसार स्कोर
- कुल72.4
- AI/LLM52.4
- गेमिंग78.2
- पोर्टेबिलिटी30
- क्रिएटर72.8
- बिज़नेस64.7
- डेवलपर70.1
- Home Office72.7
- Workstation72.1
पूरी समीक्षा जल्द ही आ रही है। ऊपर दिए गए स्पेसिफिकेशन, स्कोर, कीमतें और चार्ट हमेशा अपडेट रहते हैं।