Dell OptiPlex 5080 SFF, Core i5-10500, 16GB, 2TB SSD, Black
CPU Intel Core i5-10500
RAM 16 GB
Storage 2 TB
GPU Intel UHD Graphics 630
Form Factor sff
OS Windows 11 Pro

59 ओवरऑल स्कोर
अभी किसी विक्रेता की मौजूदा कीमत नहीं है


एक नज़र में
फायदे और नुकसान
खूबियाँ
- Strong storage (83rd percentile) 83rd
- Strong port selection (72nd percentile) 72nd
- Strong reliability (70th percentile) 70th
कमियाँ
- Below average ram (31st percentile)
- Below average user sentiment (35th percentile)
मालिकों की राय
मालिकों की राय समय के साथ कैसे बदली
विशेषग्राहकों ने वास्तव में अपनी समीक्षाएँ कब लिखीं, इसके आधार पर - ताकि आप देख सकें कि शुरुआती तारीफ़ टिकी या नहीं।
72/100हमारा AI भावना विश्लेषण
प्रमाण
प्रदर्शन
तकनीकी विशेषताएं
पूर्ण विनिर्देश
Processor
| CPU | Intel Core i5-10500 |
| Cores | 6 |
| Frequency | 3.1 GHz |
| L3 Cache | 12 MB |
Graphics
| GPU | Intel UHD Graphics 630 |
| Type | Integrated |
| VRAM Type | Shared |
Memory & Storage
| RAM | 16 GB |
| RAM Generation | DDR4 |
| Storage | 2 TB |
| Storage Type | SSD |
Build
| Form Factor | sff |
Connectivity
| USB Ports | 10 |
| DisplayPort | ✓ |
| Wi-Fi | Internal WiFi |
| Ethernet | Yes |
System
| OS | Windows 11 Pro |
प्रतिस्पर्धियों से तुलना
| Spec | Dell OptiPlex 5080 SFF | Apple Mac Studio M5 Max | Lenovo T Series Towers Legion Tower 5a Gen 10 | HP OMEN GT16-0364 | ASUS ROG GM700 | MSI Aegis ZS2 A9NVP-1407US |
|---|---|---|---|---|---|---|
| CPU | Intel Core i5-10500 | Apple M5 Max | AMD Ryzen 7 7800X3D | AMD Ryzen 7 8700F | AMD Ryzen 7 9800X3D | AMD Ryzen 9 9900X |
| RAM (GB) | 16 | 36 | 32 | 32 | 32 | 32 |
| Storage (GB) | 2048 | 1024 | 4096 | 1024 | 2048 | 2048 |
| GPU | Intel UHD Graphics 630 | Apple (32-Core) | NVIDIA GeForce RTX 5070 Ti | NVIDIA GeForce RTX 5070 | NVIDIA GeForce RTX 5070 Ti | NVIDIA GeForce RTX 5070 |
| Form Factor | sff | mini | mid-tower | mid-tower | mid-tower | mid-tower |
| Psu W | - | 480 | 850 | 850 | 850 | 750 |
| OS | Windows 11 Pro | macOS | Windows 11 Home | Windows 11 Home | Windows 11 Home | Windows 11 Home |
| Compare | Compare | Compare | Compare | Compare |
| उत्पाद | CPU | GPU | RAM | पोर्ट | स्टोरेज | User Sentiment | विश्वसनीयता |
|---|---|---|---|---|---|---|---|
| Dell OptiPlex 5080 SFF | 38.5 | 36.7 | 31.4 | 72.1 | 82.7 | 34.5 | 69.9 |
| Apple Mac Studio M5 Max Compare | 95.7 | 85.2 | 92.4 | 89 | 68.8 | 95 | 99.3 |
| Lenovo T Series Towers Legion Tower 5a Gen 10 Compare | 73.3 | 94.6 | 77.9 | 88.3 | 98.1 | 95 | 69.9 |
| HP OMEN GT16-0364 Compare | 69.5 | 90.8 | 87 | 97.9 | 53.5 | 98.5 | 69.9 |
| ASUS ROG GM700 Compare | 80.5 | 94.6 | 81.6 | 96 | 90 | 98.5 | 37.2 |
| MSI Aegis ZS2 A9NVP-1407US Compare | 92.4 | 90.8 | 87 | 90.4 | 82.7 | 88.7 | 37.2 |
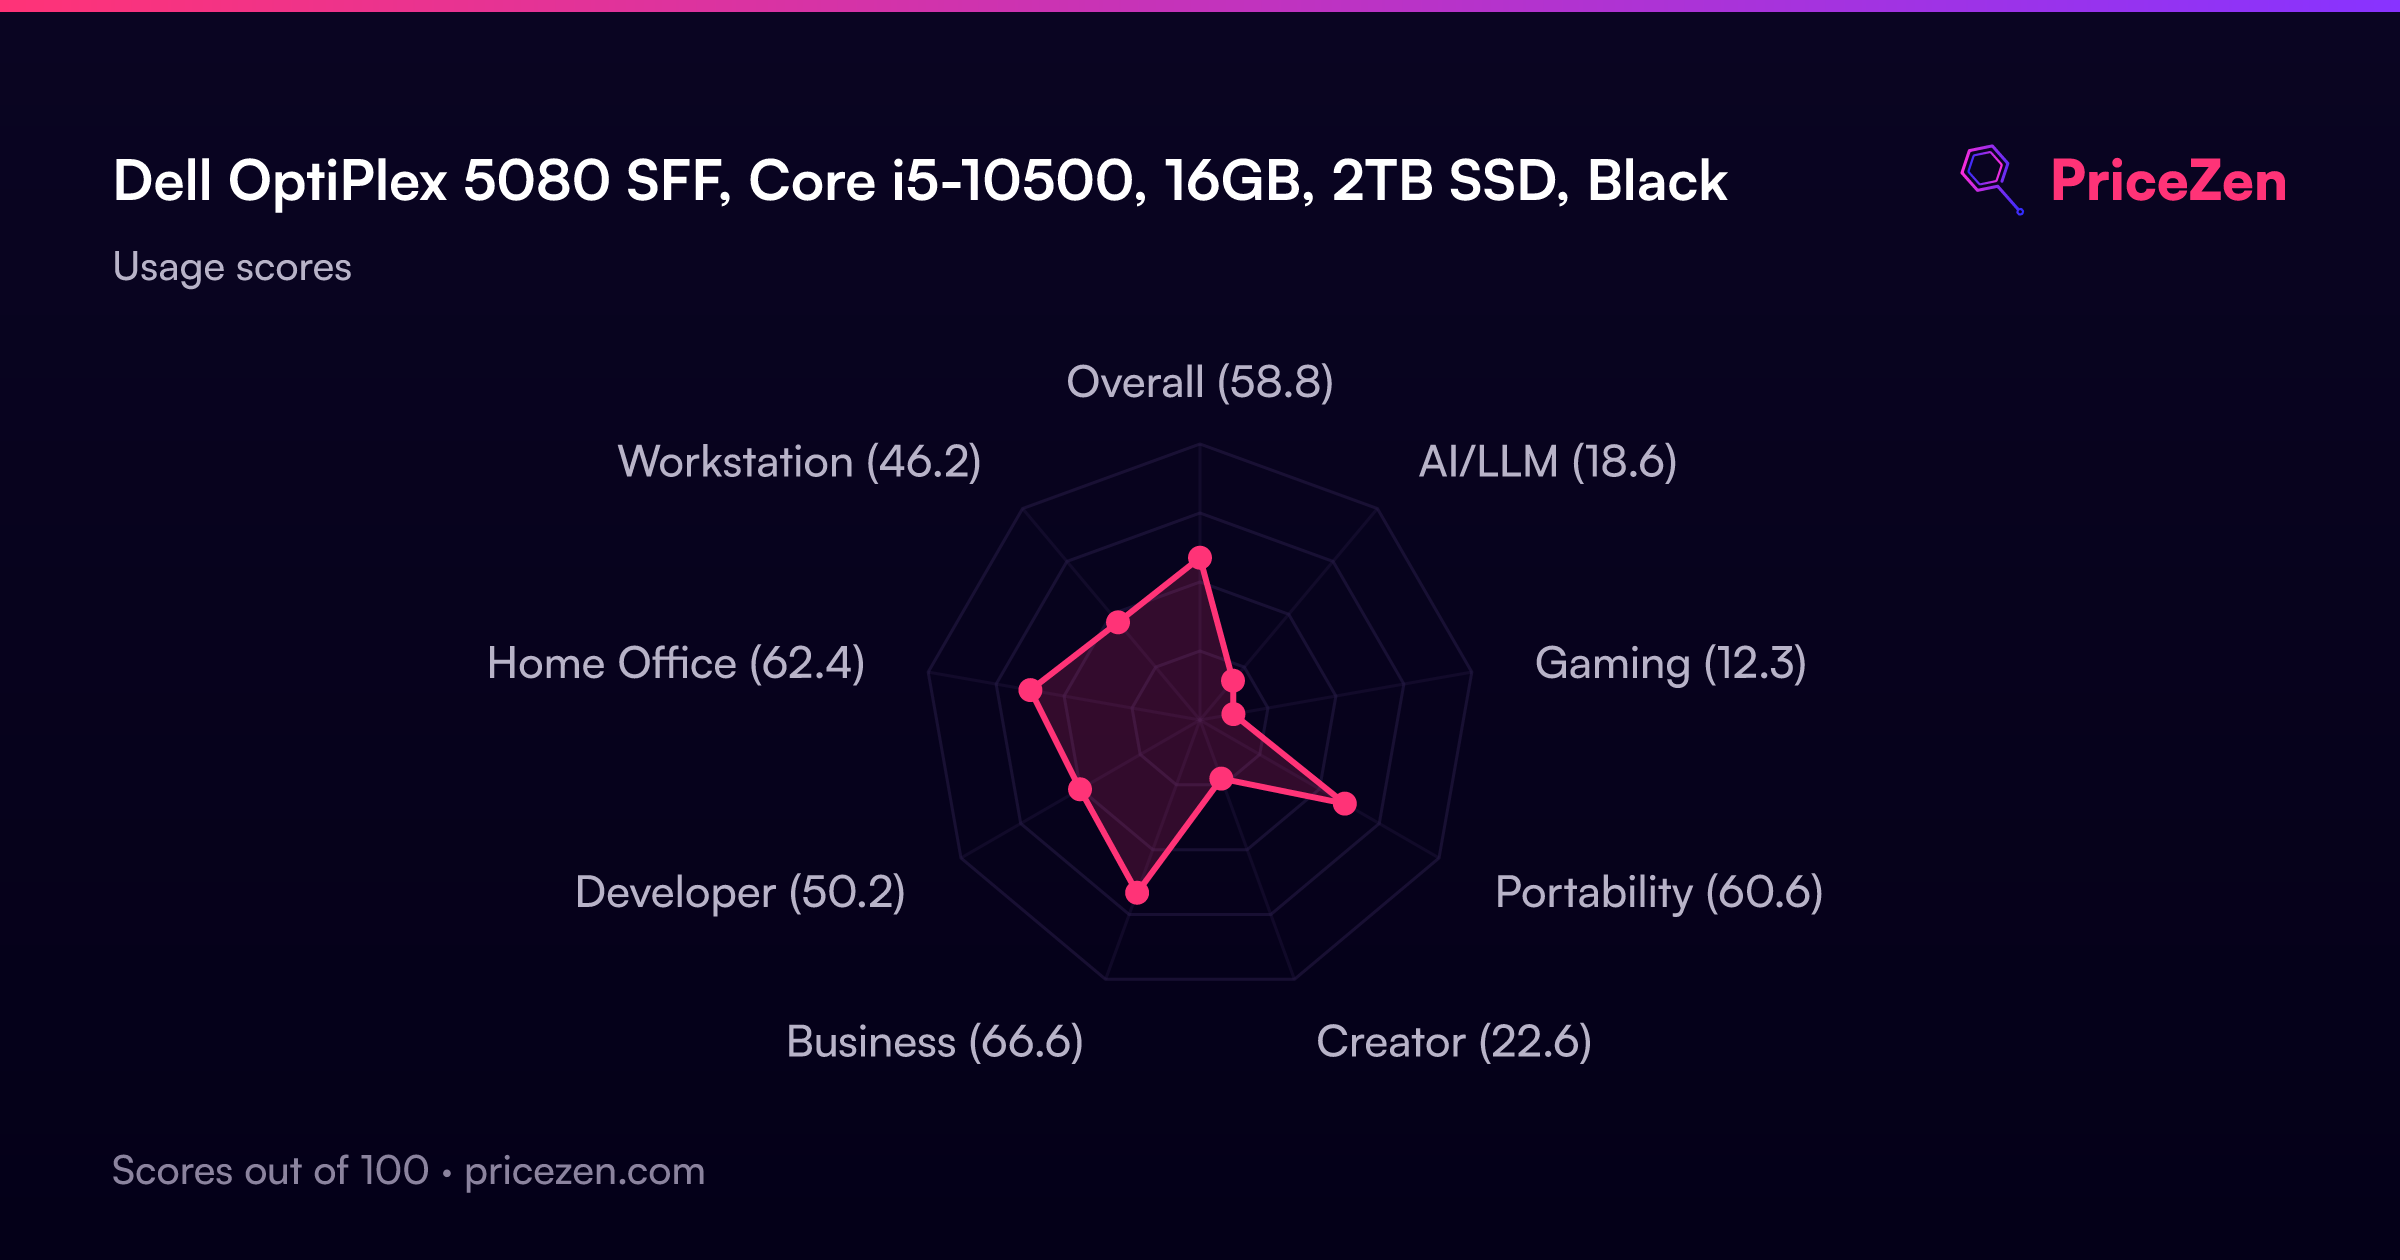
उपयोग के अनुसार स्कोर
- कुल58.8
- AI/LLM18.6
- गेमिंग12.3
- पोर्टेबिलिटी60.5
- क्रिएटर22.6
- बिज़नेस66.5
- डेवलपर50.1
- Home Office62.4
- Workstation46.2
पूरी समीक्षा जल्द ही आ रही है। ऊपर दिए गए स्पेसिफिकेशन, स्कोर, कीमतें और चार्ट हमेशा अपडेट रहते हैं।
अन्य कॉन्फ़िगरेशन19
OptiPlex 5080Intel Core i7-1070064GB1TBOptiPlex 5080Intel Core i5 1050032GB512GBOptiPlex 5080Intel Core i7-1070032GB1TBOptiPlex 5080Intel Core i7-1070016GB256GBOptiPlex 5080Intel Core i5 1050016GB256GBOptiPlex 5080Intel Core i7-1070016GB500GBOptiPlex 5080Intel Core i7-1070032GB500GBOptiPlex 5080Intel Core i7 1070016GB256GBOptiPlex 5080Intel Core i7 1070016GB1536GB
सभी 19 कॉन्फ़िगरेशन दिखाएं
OptiPlex 5080Intel Core i5 1050016GB1TBOptiplex 5080Intel Core i5 1050032GB1TBOptiPlex 5080Intel Core i7 1070032GB512GBOptiPlex 5080Intel Core i5 1050016GB512GBOptiPlex 5080Intel Core i7-1070032GB256GBOptiPlex 5080Intel Core i7-1070032GB500GBOptiPlex 5080Intel Core i7-1070016GB500GBOptiPlex 5080 SFFIntel Core i7 1070016GB1152GBOptiPlex 5080 SFFIntel Core i5 1050016GB512GBOptiPlex 5080 SFFIntel Core i7 1070064GB2TB