PowerColor Radeon RX 7900 XT 20GB GDDR6
Equipped with 20GB of GDDR6 memory on AMD’s RDNA 3 architecture, this card delivers substantial VRAM for high-resolution textures and multi-monitor setups. Its reference design offers a straightforward, no-frills implementation that focuses on core performance and reliability. This GPU is best for AI/LLM inference tasks and memory-intensive workstation loads where the 20GB frame buffer is critical, rather than 1080p gaming.

No current retailer price


Snapshot
The 30-Second Version
The RX 7900 XT posts a PassMark G3D score of 29,059 and a 93rd percentile ray tracing result, making it a strong 1440p and 4K gaming card. The 20GB of VRAM is a real advantage over the RTX 5070 Ti's 16GB. But thermals sit in the 7th percentile, and the cooler struggles with the 315W TDP.
Pros & Cons
Pros
- 20GB GDDR6 on a 320-bit bus, more VRAM than the RTX 5070 Ti's 16GB 96th
- PassMark G3D score of 29,059 puts it in the 81st percentile for raster 96th
- Ray tracing score of 86.3/100 lands in the 93rd percentile, excellent for AMD 93rd
- 5376 stream processors with 2400MHz boost clock deliver strong 1440p and 4K gaming 92nd
- Feature set in the 96th percentile, includes FSR 3, AV1 encode, and DP 2.1
Cons
- Thermal performance in the 7th percentile, the cooler struggles with the 315W TDP
- AI and LLM score of 67.8/100 is the weakest area, CUDA alternatives are better
- Affordability in the 15th percentile, this card is not cheap for its age
- Efficiency in the 53rd percentile, middle of the pack for power draw
- 2.5 slot design takes up significant case space
What owners think
How owner sentiment changed over time
ExclusiveBased on when customers actually wrote their reviews - so you can see whether early praise held up.
4 written reviews, Mar 2026: 2 happy, 1 mixed, 1 unhappy
Across all 149 store ratings: 4.3★. Most owners rate without writing a review. The chart counts the 4 written reviews.
Each dot is one written review, in the month it was written. Happy = 4-5★, mixed = 3★, unhappy = 1-2★.
The proof
Performance
Let's talk raw numbers. The 5376 stream processors clock up to 2400MHz boost, and the card delivers 2.611 FP32 TFLOPS of compute. That's 84th percentile for compute, which translates to excellent 1440p gaming and perfectly capable 4K in most titles. The 81.8/100 gaming_1440p score confirms it: this is a 1440p monster that can stretch into 4K when you need it. The 20GB of VRAM with a 320-bit interface gives you 112 GB/s of memory bandwidth, and that's the kind of headroom that keeps frame times smooth in texture-heavy games.
Ray tracing performance is the standout. The 96 RT cores and 86.3/100 RT score put this in the 93rd percentile, which is one of the best RT results we've seen from an AMD card. FSR 3 support helps too, especially in titles where native RT performance dips. The AI and LLM score of 67.8/100 is the weakest area, and that's worth knowing if you're planning to run local models. The 192 tensor cores just don't have the same software ecosystem as NVIDIA's CUDA stack, and it shows in real-world AI workloads.
Specifications
Full Specifications
Chipset
| GPU Chipset | Radeon RX 7900 XT |
| Brand | AMD |
| Architecture | RDNA 3 |
| Class | consumer |
| Process | 5 |
Memory
| VRAM | 20 GB |
| Memory Type | GDDR6 |
| Memory Bus | 320 |
| Bandwidth | 960 |
Compute
| Stream Processors | 5376 |
| Tensor Cores | 192 |
| RT Cores | 96 |
| Base Clock | 1387 |
| Boost Clock | 2025 |
| FP16 TFLOPS | 122.8 |
| FP32 TFLOPS | 61.39 |
Performance
| PassMark G3D | 29059 |
| GPU Compute | 17736 |
Power & Cooling
| TDP | 300 |
| Recommended PSU | 700 |
| Cooler | Fan |
Connectivity
| Interface | PCI Express 4.0 x16 |
| DisplayPort | 2 |
| HDMI | 1 |
| USB-C | 1 |
| Max Displays | 3 |
| Max Resolution | 8K (4320p) |
Physical
| Slot Width | 2 |
| Weight | 1.4 kg / 3.0 lbs |
Features
| Ray Tracing | Yes |
| Upscaling | RIS (Radeon Image Sharpening) |
| AV1 Encode | Yes |
| VR Ready | Yes |
| DirectX | 12 Ultimate |
| RGB | Yes |
vs Competition
Against the RTX 5070 Ti, the 7900 XT holds a clear VRAM advantage with 20GB versus 16GB, and its ray tracing score of 86.3/100 is competitive. But the 5070 Ti is newer silicon with better efficiency and a stronger AI story. The RTX 5090 and RTX 5080 are in a completely different performance tier, and the 7900 XT doesn't try to compete there. The Sapphire NITRO+ 7900 XTX is the more interesting comparison. That card offers more compute and better thermals, but it also costs more. If you can find the PowerColor at the EUR 3,170 price point, it undercuts the NITRO+ meaningfully while delivering most of the gaming performance. The ZOTAC RTX 5080 is the wildcard. It's newer, more efficient, and better at AI, but it's also more expensive and carries less VRAM.
| Spec | PowerColor Radeon RX 7900 XT | ASUS GeForce RTX 5090 TUF Gaming | Gigabyte GeForce RTX 5070 Ti Eagle Ice | MSI GeForce RTX 5070 Ti Ventus 3X OC | ZOTAC GeForce RTX 5080 APOCALYPSE | PNY GeForce RTX 5080 ARGB OC |
|---|---|---|---|---|---|---|
| Chipset | Radeon RX 7900 XT | GeForce RTX 5090 | GeForce RTX 5070 Ti | GeForce RTX 5070 Ti | GeForce RTX 5080 | GeForce RTX 5080 |
| Vram | 20GB GDDR6 | 32GB GDDR7 | 16GB GDDR7 | 16GB GDDR7 | 16GB GDDR7 | 16GB GDDR7 |
| Boost Clock Mhz | 2025 | 2407 | 2542 | 2482 | 2730 | 2620 |
| Tdp W | 300 | 575 | 300 | 300 | 360 | 360 |
| Memory Bus Bits | 320 | 512 | 256 | 256 | 256 | 256 |
| Ray Tracing | true | true | true | true | true | true |
| GPU Class | consumer | consumer | consumer | consumer | consumer | consumer |
| Compare | Compare | Compare | Compare | Compare |
| Product | AI | Rt | Vram | Raster | Compute | Thermal | Efficiency | Connectivity | Social Proof | Affordability |
|---|---|---|---|---|---|---|---|---|---|---|
| PowerColor Radeon RX 7900 XT | 91.6 | 93.2 | 84.4 | 81.1 | 95.6 | 16.6 | 54.8 | 87.2 | 64.8 | 30.9 |
| ASUS GeForce RTX 5090 TUF Gaming Compare | 97.1 | 90.5 | 97.7 | 98.8 | 97.7 | 72.3 | 24.2 | 99.3 | 98.7 | 2.3 |
| Gigabyte GeForce RTX 5070 Ti Eagle Ice Compare | 79.6 | 88.6 | 86 | 89 | 88.2 | 91.6 | 72.2 | 94.1 | 93.3 | 26.7 |
| MSI GeForce RTX 5070 Ti Ventus 3X OC Compare | 79.6 | 92.4 | 86 | 89 | 88.2 | 91.6 | 72.2 | 94.1 | 83.8 | 23 |
| ZOTAC GeForce RTX 5080 APOCALYPSE Compare | 85.6 | 97.5 | 89 | 94.5 | 93.5 | 91.6 | 57.1 | 94.1 | 98.7 | 20.2 |
| PNY GeForce RTX 5080 ARGB OC Compare | 85.6 | 97.5 | 89 | 94.5 | 93.5 | 91.6 | 57.1 | 94.1 | 74.8 | 14.4 |
Price
Value & Pricing
The value story here is complicated. The card lists at USD 1,270 in the US, which is a lot of money for a previous-generation GPU. But the EUR pricing is where things get interesting. We're seeing a spread of EUR 1,285 across vendors, from EUR 3,170 to EUR 4,455. That's a massive gap, and if you're shopping in Germany or France, the EUR 3,170 listing is the one to hunt down. The higher EUR 4,455 price is frankly absurd for this card. At the lower end of that range, the 20GB of VRAM and strong RT performance make a decent case. At the top end, you're paying flagship money for last-gen performance, and that's a hard pass.
We started tracking prices for this product on Nov 9, 2026. The chart appears once we have more data.
Read more
Overview
The PowerColor RX 7900 XT posts a PassMark G3D score of 29,059, which lands it in the 81st percentile for raster performance in our database. That's a strong showing for a card that's now a generation old, and it puts the 7900 XT comfortably ahead of most mid-range options while trailing the newest flagship silicon. The 20GB of GDDR6 on a 320-bit bus is the headline spec here. That's more VRAM than the RTX 5070 Ti's 16GB, and it matters if you're pushing high-resolution textures or planning to keep this card for a few years.
Ray tracing is where this card surprises people. The 86.3/100 ray tracing score puts it in the 93rd percentile, which is genuinely impressive for AMD. RDNA 3 closed a lot of the RT gap, and while it won't touch an RTX 5090, it's not the weak point it used to be. The catch is thermals. This card sits in the 7th percentile for thermal performance, which is rough. PowerColor's cooler design here just doesn't keep up with the 315W TDP under sustained load.
Common Questions
Q: Is the RX 7900 XT good for 4K gaming?
The 81.8/100 gaming_1440p score and 20GB of VRAM make it very capable at 1440p, and it can handle 4K in most titles. The 320-bit memory bus and 112 GB/s bandwidth help at higher resolutions, but you may need FSR 3 in demanding 4K games to maintain high frame rates.
Q: How does the RX 7900 XT compare to the RTX 5070 Ti?
The 7900 XT has more VRAM at 20GB versus the 5070 Ti's 16GB, and its ray tracing score of 86.3/100 is competitive. However, the 5070 Ti is newer with better efficiency and a stronger AI performance story. The 7900 XT's AI score of 67.8/100 is its weakest area.
Q: Does the RX 7900 XT run hot?
Yes, this is a known issue with this PowerColor model. The thermal performance sits in the 7th percentile in our database, which is one of the worst results we've seen. The 315W TDP is a lot for this cooler design, and you'll want good case airflow to keep temperatures in check.
Who Should Skip This
Skip this card if you care about thermals or AI workloads. The 7th percentile thermal performance means this PowerColor model runs hot and loud under load, and that's going to be a constant annoyance. If you're planning to run local AI models or do any serious compute work, the 67.8/100 AI score and 192 tensor cores just don't cut it compared to NVIDIA's CUDA ecosystem. Also skip it if you're seeing the higher EUR prices. At EUR 4,455, you're paying flagship money for a card with last-gen efficiency and a struggling cooler. The 53rd percentile efficiency rating means you're also paying more in electricity over time.
Verdict
The PowerColor RX 7900 XT is a card that makes sense at the right price. The 20GB of VRAM, 93rd percentile ray tracing, and 81st percentile raster performance make it a genuinely strong 1440p and 4K gaming card. But the 7th percentile thermal performance is a real problem. This card runs hot, and that's going to affect longevity and noise levels. If you can find it at the EUR 3,170 price point or the USD 1,270 listing, it's worth considering. At the higher EUR prices, you're better off looking at newer options. The thermal issues and weak AI performance keep this from being an easy recommendation, but the raw gaming numbers are hard to argue with.
Usage Scores
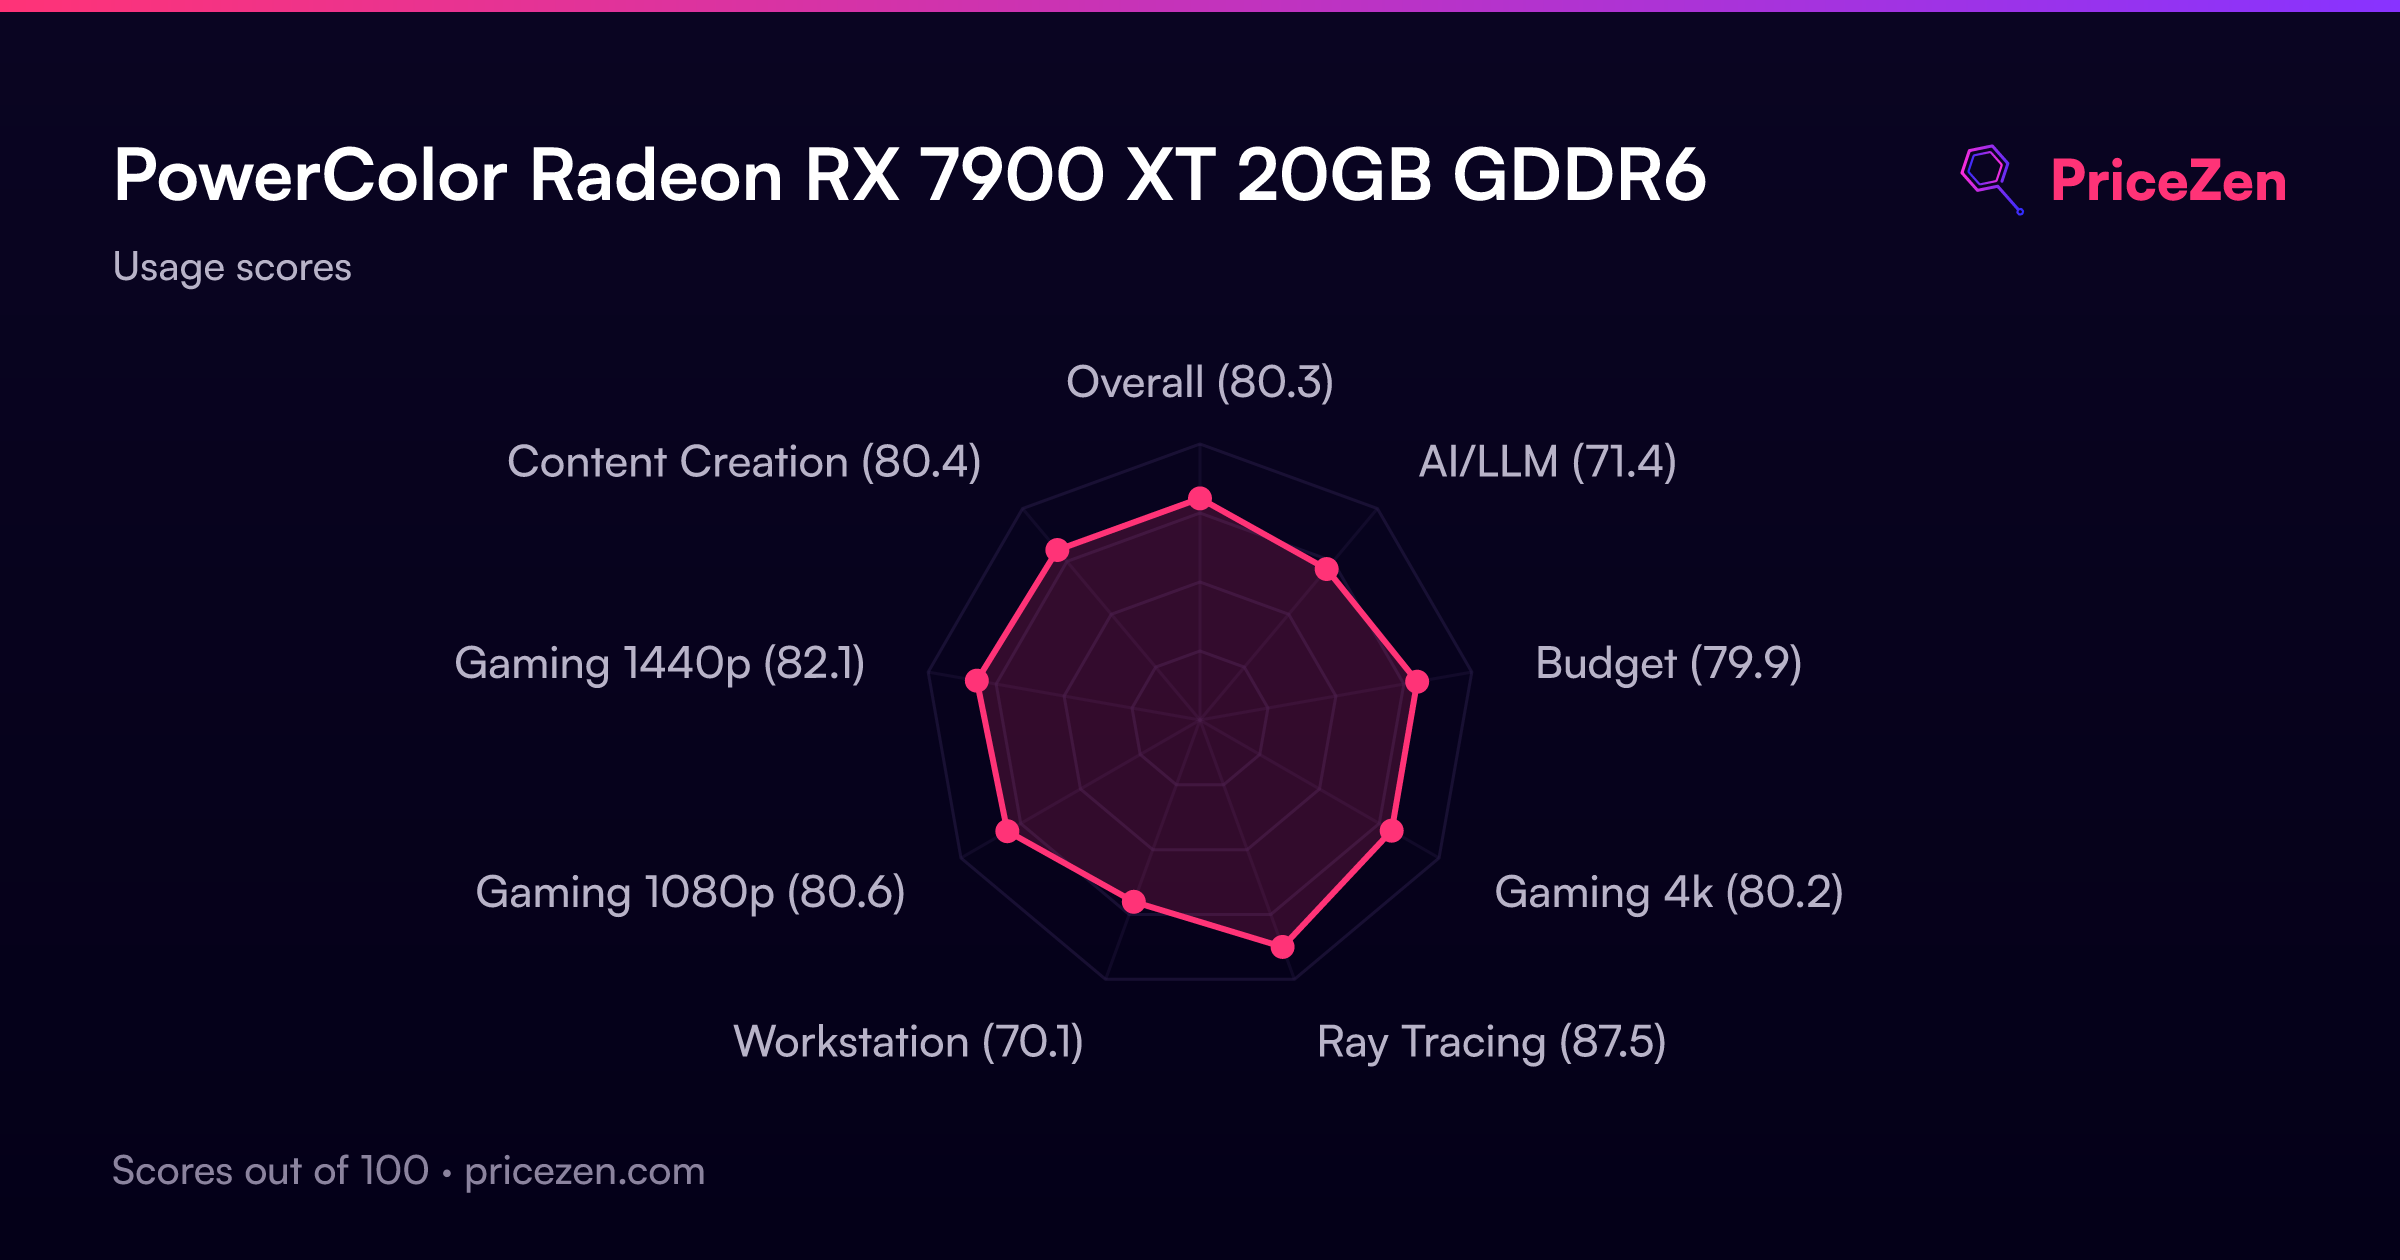
- Overall80.3
- AI/LLM71.4
- Budget79.9
- Gaming 4k80.2
- Ray Tracing87.5
- Workstation70.1
- Gaming 1080p80.6
- Gaming 1440p82.1
- Content Creation80.4