Novo
ASUS TUF Gaming F16, Core i7-14650HX, 16GB, 512GB SSD, RTX 5050, Jaeger Gray
CPU Intel Core i7 14650HX
RAM 16 GB
Storage 512 GB
Screen 16" 1920x1200
GPU NVIDIA GeForce RTX 5050
OS Windows 11 Home
Weight 2.2 kg
Battery 70 Wh

57 Pontuação Geral
Sem preço atual de lojas
Resumo
Prós e contras
Prós
- Strong cpu (88th percentile) 88th
- Strong gpu (82nd percentile) 82nd
- Strong screen (76th percentile) 76th
- Strong port selection (68th percentile) 68th
Contras
- Below average portability (16th percentile)
- Below average affordability (31st percentile)
As provas
Desempenho
Especificações
Especificações completas
Processor
| CPU | Intel Core i7 14650HX |
| Cores | 16 |
| Frequency | 2.2 GHz |
| L3 Cache | 30 MB |
Graphics
| GPU | NVIDIA GeForce RTX 5050 |
| Type | Discrete |
| VRAM | 8 GB |
Memory & Storage
| RAM | 16 GB |
| RAM Generation | DDR5 |
| Storage | 512 GB |
| Storage Type | NVMe SSD |
Display
| Size | 16" |
| Resolution | 1920x1200 (Full HD) |
| Panel | IPS |
| Refresh Rate | 144 Hz |
| Brightness | 300 nits |
| Color Gamut | 100% sRGB, 72% NTSC, 75.35% Adobe RGB |
Connectivity
| USB-C Ports | 1 |
| USB Ports | 3 |
| HDMI | ✓ |
| Wi-Fi | Wi-Fi 6E |
| Bluetooth | Bluetooth 5.4 |
| Ethernet | Gigabit Ethernet |
Physical
| Weight | 2.2 kg / 4.9 lbs |
| Battery | 70 Wh |
| OS | Windows 11 Home |
Face à concorrência
| Spec | ASUS TUF Gaming F16 | Apple MacBook Pro 14.2" M4 Max | Lenovo Legion Pro 7i Gen 10 16" | HP OMEN Transcend | Samsung Galaxy Book5 Pro 14" NP944XHA-KG3US | Dell Premium 14.5" LDA14250-7667SLV-PUS |
|---|---|---|---|---|---|---|
| CPU | Intel Core i7 14650HX | Apple M4 Max | Intel Core Ultra 9 275HX | Intel Core Ultra 9 285H | Intel Core Ultra 7 258V | Intel Core Ultra 7 255H |
| RAM (GB) | 16 | 64 | 32 | 32 | 32 | 32 |
| Storage (GB) | 512 | 4096 | 1024 | 1024 | 1024 | 1024 |
| Screen | 16" 1920x1200 | 14.2" 3024x1964 | 16" 2560x1600 | 14" 2880x1800 | 14" 2880x1800 | 14.5" 3200x2000 |
| GPU | NVIDIA GeForce RTX 5050 | Apple (40-Core) | NVIDIA GeForce RTX 5070 Ti | NVIDIA GeForce RTX 5070 | Intel Arc Graphics 140V | Intel Arc Graphics |
| OS | Windows 11 Home | macOS | Windows 11 Home | Windows 11 Home | Windows 11 Pro | Windows 11 Home |
| Weight (kg) | 2.2 | 1.6 | 2.7 | 1.6 | 1.2 | 1.7 |
| Battery (Wh) | 70 | 72 | 99 | 71 | 63 | 62 |
| Compare | Compare | Compare | Compare | Compare |
| Produto | CPU | GPU | RAM | Portas | Tela | Portabilidade | Armazenamento | Confiabilidade | Affordability |
|---|---|---|---|---|---|---|---|---|---|
| ASUS TUF Gaming F16 | 88.1 | 81.9 | 59.7 | 67.5 | 76.2 | 16 | 50.8 | 60.7 | 31.4 |
| Apple MacBook Pro 14.2" M4 Max Compare | 93.7 | 91.6 | 95.7 | 73.1 | 99.3 | 68.8 | 98.4 | 98.3 | 1.7 |
| Lenovo Legion Pro 7i Gen 10 16" Compare | 97.2 | 96.6 | 89 | 97.2 | 95.6 | 9.6 | 79.2 | 82.1 | 5.6 |
| HP OMEN Transcend Compare | 90.1 | 93.5 | 89.7 | 89.2 | 96.5 | 72.3 | 65.1 | 33.6 | 8.5 |
| Samsung Galaxy Book5 Pro 14" NP944XHA-KG3US Compare | 65.7 | 69.6 | 79.4 | 83 | 91.6 | 89.5 | 79.2 | 82.1 | 20.6 |
| Dell Premium 14.5" LDA14250-7667SLV-PUS Compare | 87 | 69.6 | 89 | 65.8 | 97.2 | 61.2 | 65.1 | 33.6 | 14 |
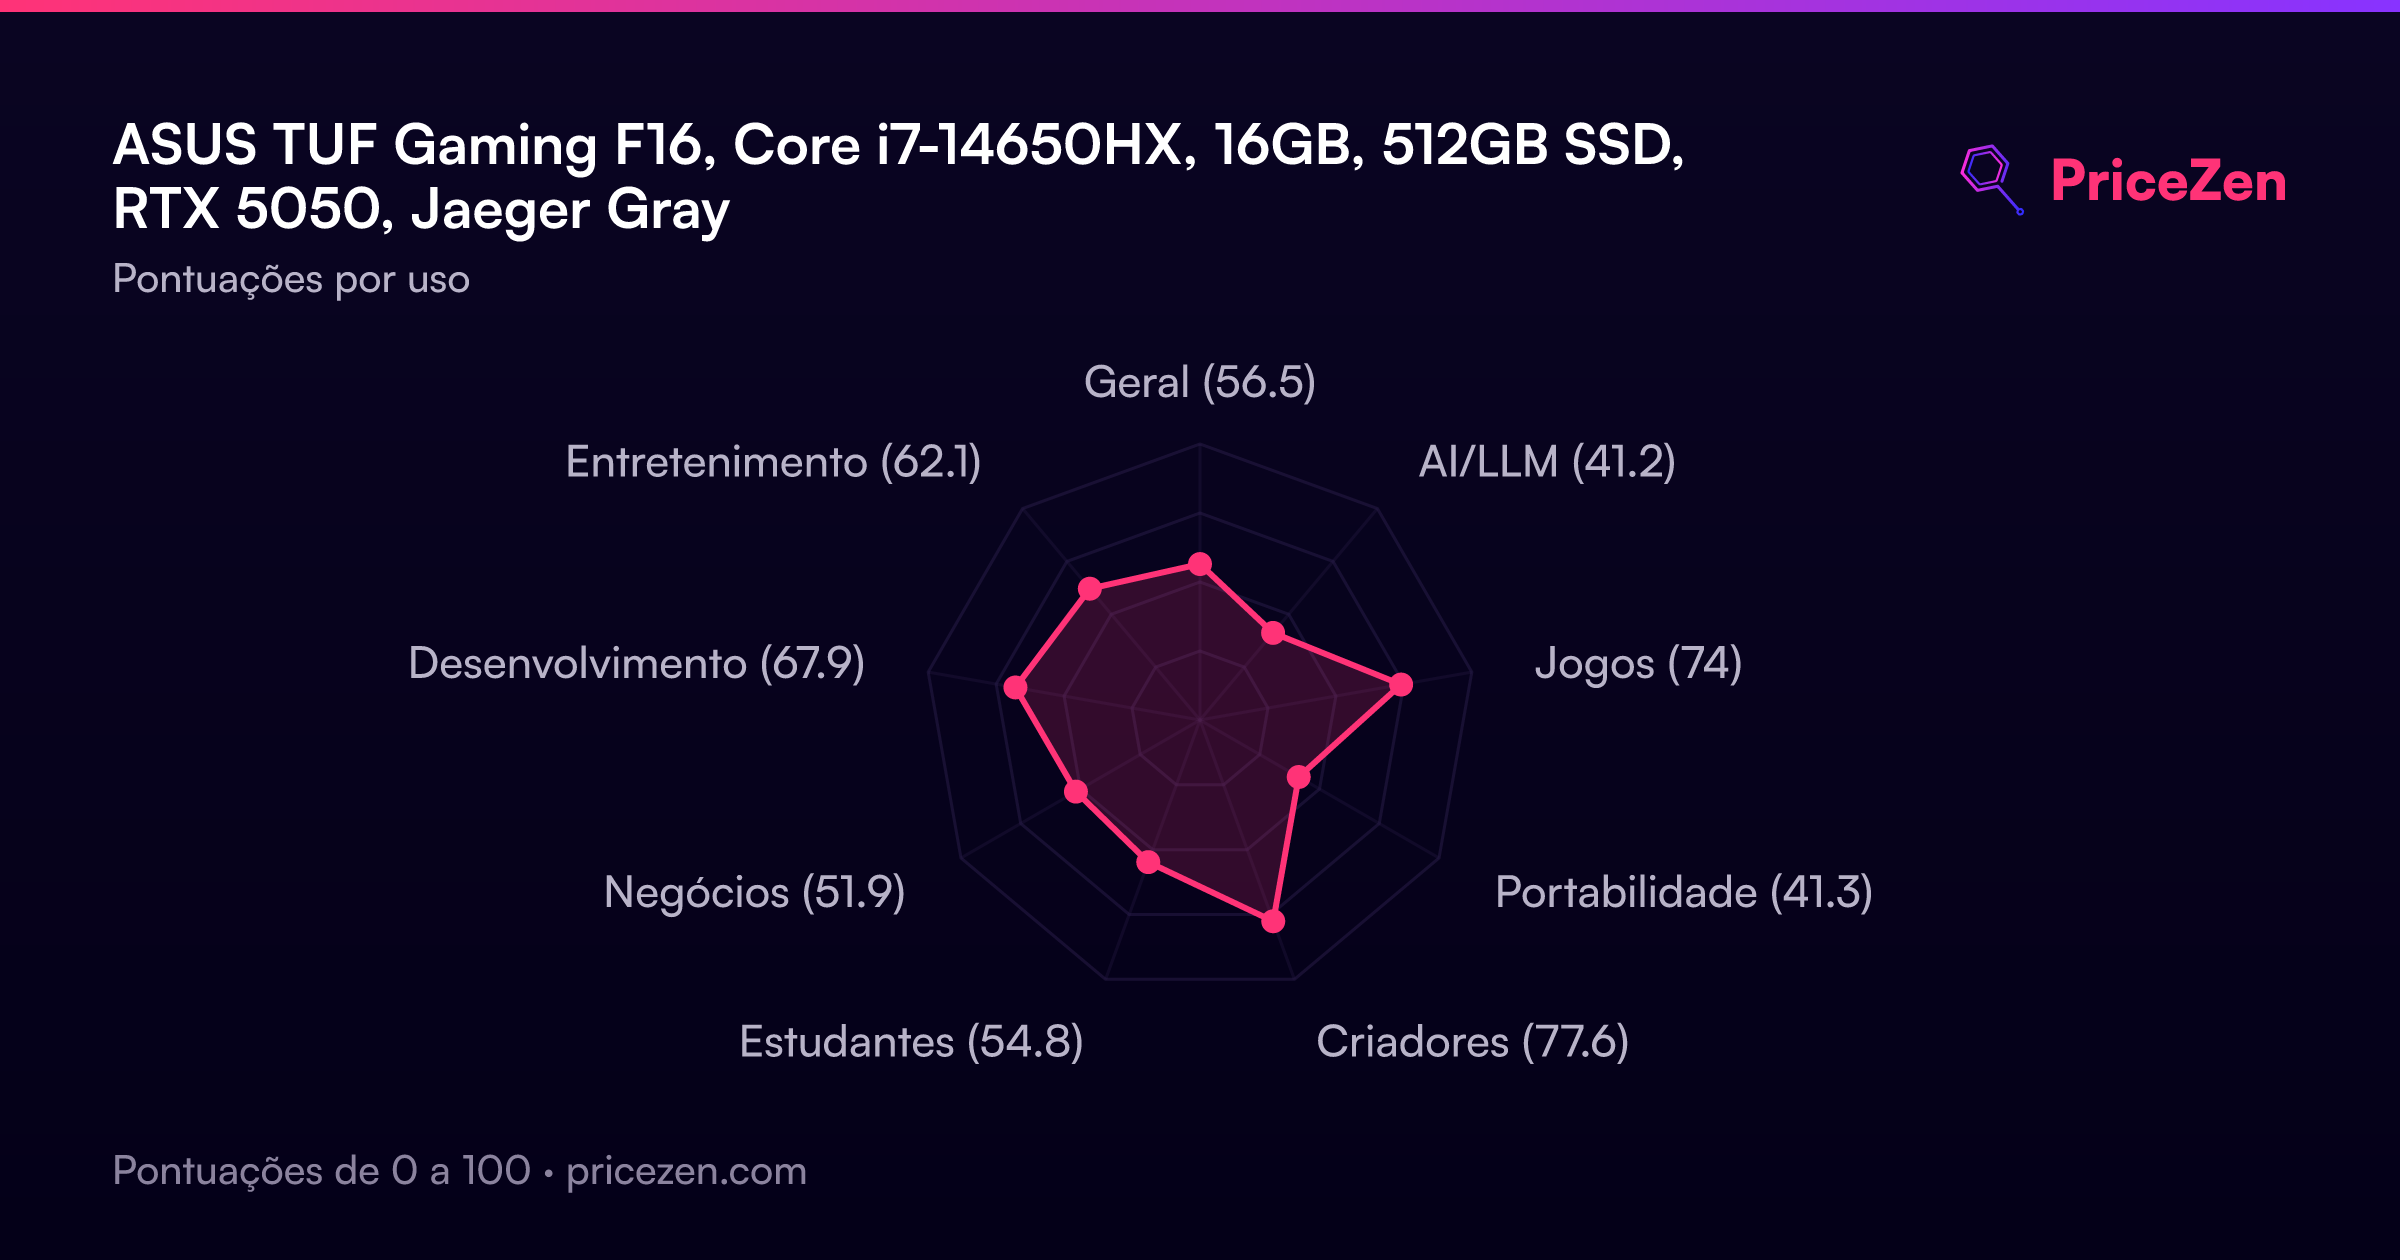
Pontuações por utilização
- Geral56.5
- AI/LLM41.2
- Jogos74
- Portabilidade41.3
- Criadores77.6
- Estudantes54.8
- Negócios51.9
- Desenvolvimento67.9
- Entretenimento62.1
Uma análise completa chega em breve. As especificações, pontuações, preços e gráficos acima estão sempre atualizados.
Outras configurações15
TUF Gaming 16" FX608JHR-DS74Intel Core i7 14650HX16GB1TBJaeger GrayTUF F16 FX608JPR-WH74Intel Core i7 14650HX16GB1TBGrayTUF Gaming 16" FX608JMR-RS76-CAIntel Core i7 14650HX32GB1TBJaeger GrayTUF 16" FX608JMR-BS74-CBIntel Core i7 14650HX16GB1TBJaeger GreyTUF Gaming F16Intel Core i5 13450HX16GB512GBJaeger GrayTUF Gaming F16Intel Core i5 13450HX16GB1TBTUF Gaming 16" FX608LP-BS96Intel Core Ultra 9 275HX32GB1TBTUF Gaming F16 FX608JHR-ES73Intel Core i7 14650HX16GB512GBJaeger GrayTUF Gaming F16 FX608LM-BS96Intel Core Ultra 9 275HX32GB1TB